| Version 1 (modified by chunter, 9 years ago) (diff) |
|---|
WARPLab 7
- Downloads
Getting Started
- Sample Buffer Sizes
- Automatic Gain Control
- Examples
- Extending WARPLab
- Debugging Errors
- Porting Code
- Benchmarks
WARPLab 7 Framework
WARPLab 7 Reference Design
Reference Design Modules
- Node
Interface Group
Baseband
Transport
Trigger Manager
Hardware
WARPLab 7 Example: SISO OFDM
File: wl_example_siso_spectrogram.m
This WARPLab example implements a simple receiver spectrogram and does not require any MATLAB toolboxes. While this example can run on any WARPLab 7 installation, it is intended for WARPLab 7.5 and above as those designs support much larger sample buffer lengths.
Detailed Description
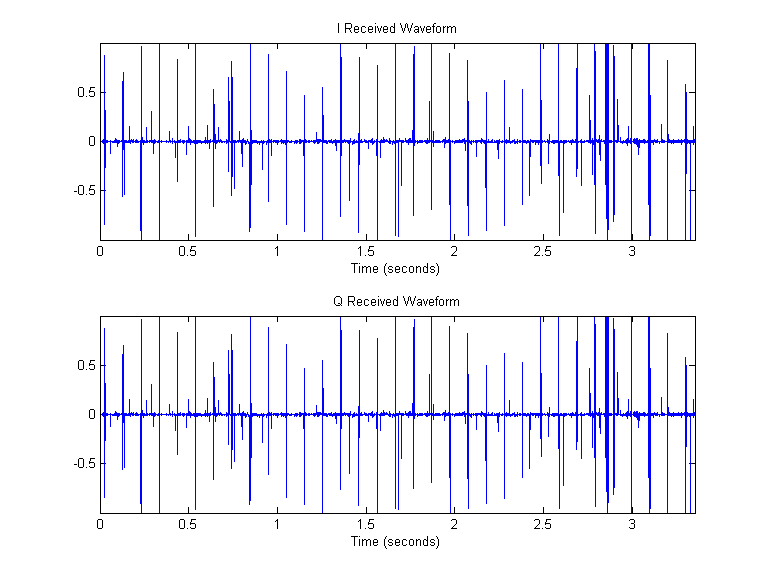
As of WARPLab 7.5, the available size of the receive sample buffer is 128M samples for the 2RF design. This is 4000x larger than the 32k sample buffer sizes in WARPLab 7.4. For more perspective on that number, 32k samples at 40 Msps (i.e. 40 MHz of bandwidth) yields an entire buffer length 819 µsec. This is long enough for a reasonable length packet transmission, but not much more. With WARPLab 7.5, capturing the entire receive buffer yields a full 3.35 seconds of reception at the same 40MHz of bandwidth.
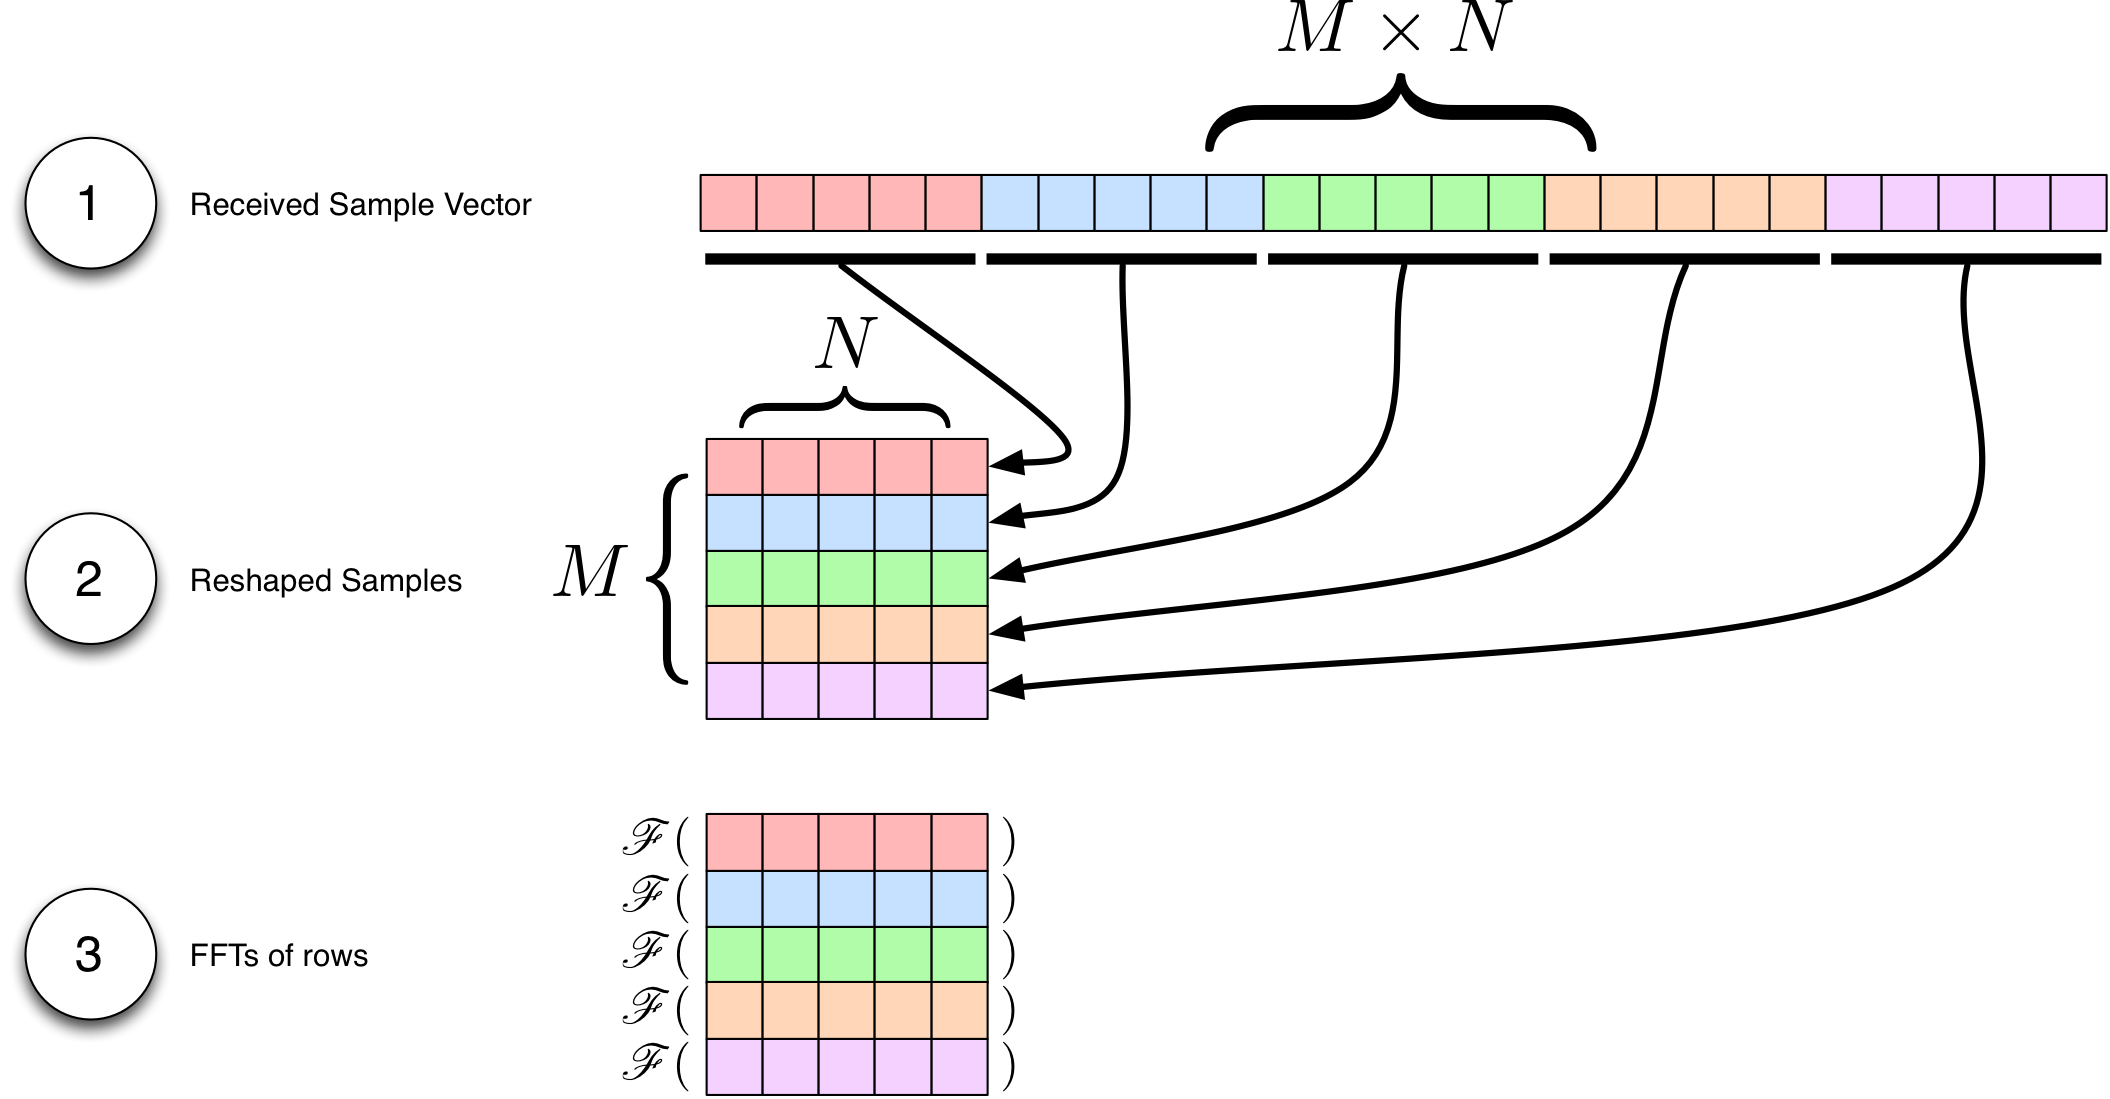
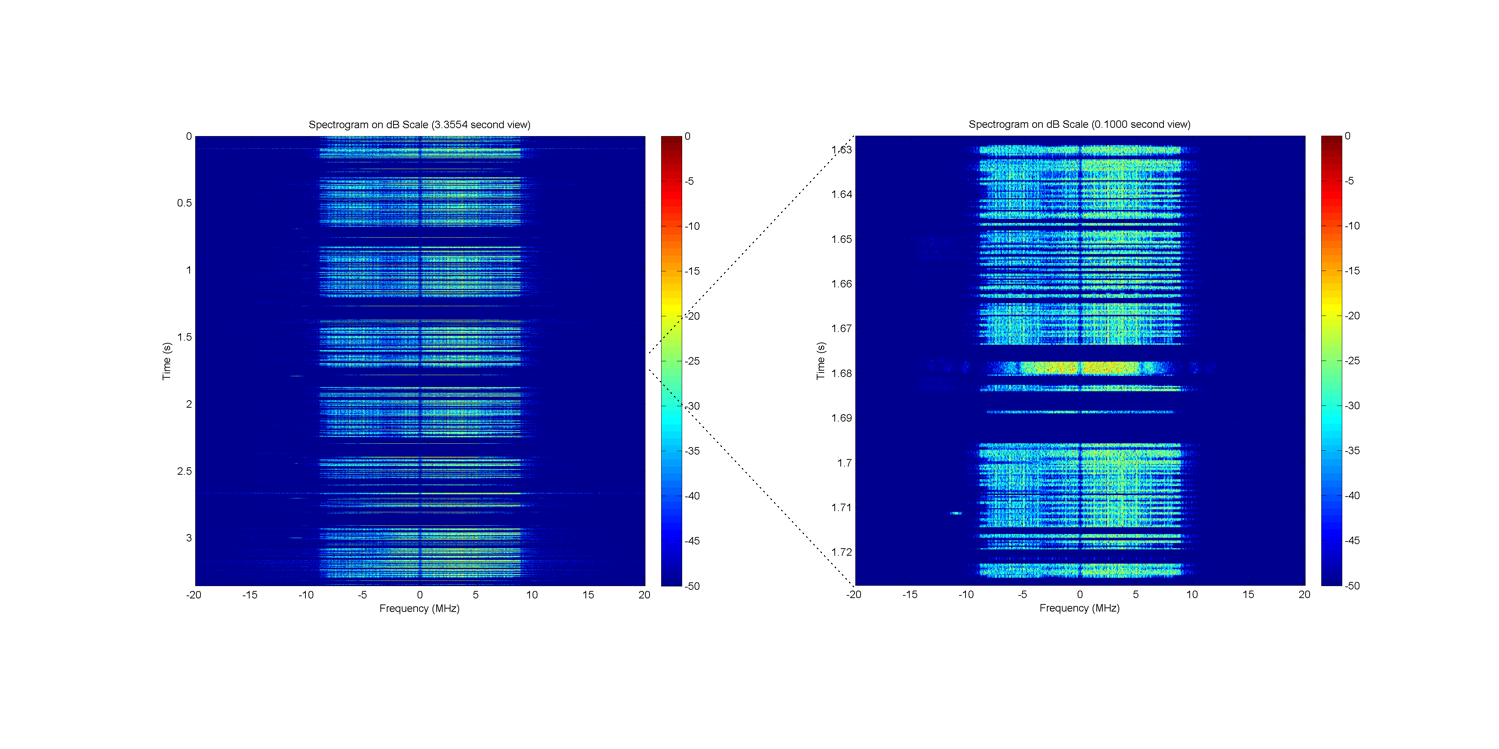
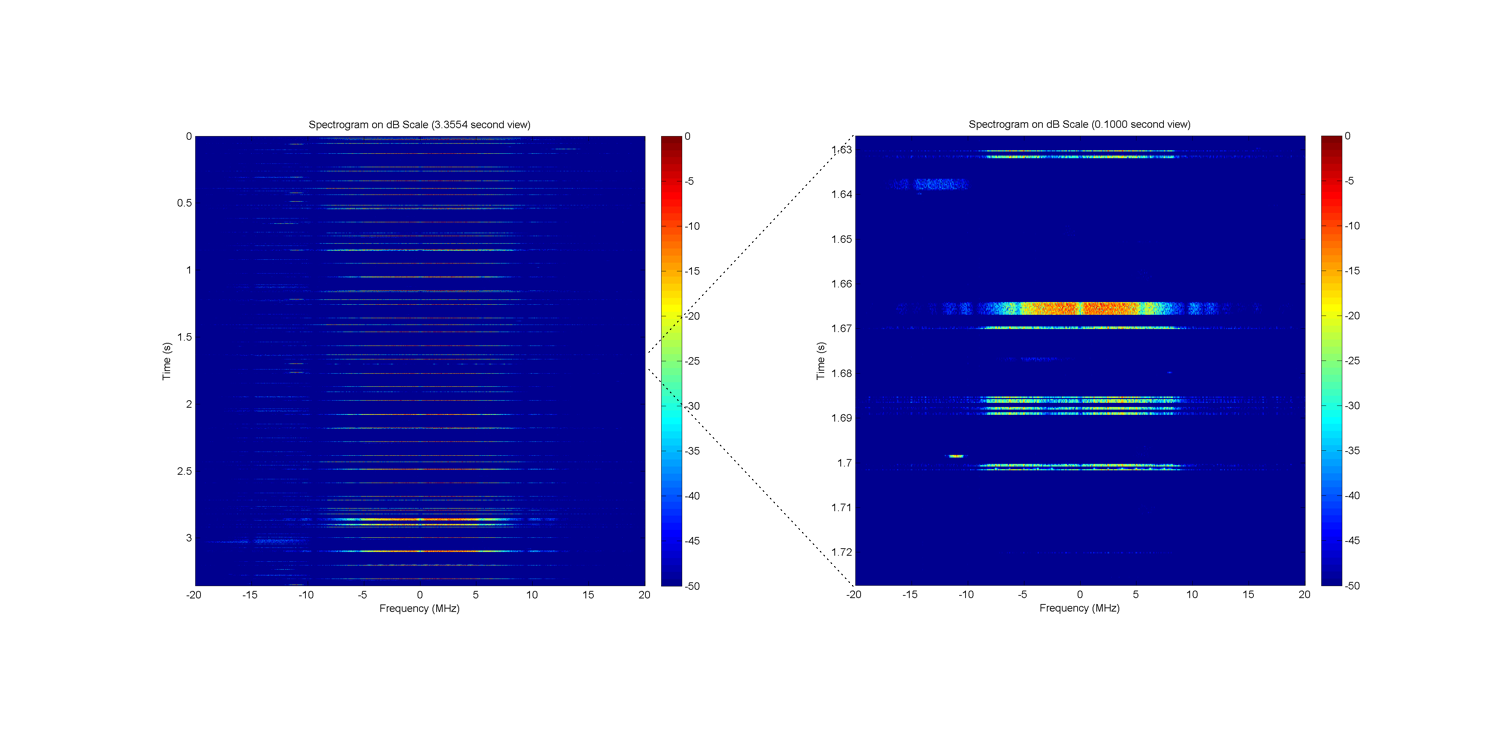
There are many usage scenarios where these expanded buffer lengths are useful. One such usage scenario is monitoring channel activity. With over 3 seconds of received waveform at a full 40MHz of bandwidth, we can see both a large extent of channel activity at very fine timescales. One popular visualization of frequency content across time is known as a spectrogram. In this example, we will use this technique to visualize activity in the 2.4 GHz band.
Attachments (4)
- spectrogram_steps.png (175.2 KB) - added by chunter 9 years ago.
- wl_spectrogram_busy.png (633.8 KB) - added by chunter 9 years ago.
- wl_spectrogram_idle.png (289.6 KB) - added by chunter 9 years ago.
- wl_rx_timeseries_idle.png (7.4 KB) - added by chunter 9 years ago.
Download all attachments as: .zip