WARP Project Forums - Wireless Open-Access Research Platform
You are not logged in.
#1 2016-May-18 02:39:07
- satlab
- Member
- Registered: 2015-Jul-09
- Posts: 9
phy performance of 802.11 ref design 1.5.1
Hello,
Is there any test stuff about the phy performance of newly updated 802.11n ref design 1.5.1 version, especially the minimum receiver sensitivity of each mode.
thanks a lot!
Offline
#2 2016-May-18 09:33:56
- murphpo
- Administrator
- From: Mango Communications
- Registered: 2006-Jul-03
- Posts: 5159
Re: phy performance of 802.11 ref design 1.5.1
The Rx sensitivity of the v1.5 PHY is definitely better than previous releases. We verified this by comparing v1.4 and v1.5 PER curves on the same WARP v3 kits connected through a variable attenuator. However we still need to run formal sensitivity tests with commercial test equipment like we did last year. We're planning to rent the equipment to run these tests later this summer.
Offline
#3 2016-May-19 02:29:52
- satlab
- Member
- Registered: 2015-Jul-09
- Posts: 9
Re: phy performance of 802.11 ref design 1.5.1
Hi murphpo,
very excited to get the news, would you tell how many dB more your attenuator got when compared with the previous version, especially the BPSK mode, thank you !
Last edited by satlab (2016-May-20 02:02:53)
Offline
#4 2016-May-20 09:56:36
- murphpo
- Administrator
- From: Mango Communications
- Registered: 2006-Jul-03
- Posts: 5159
Re: phy performance of 802.11 ref design 1.5.1
Here's a PER curve from my tests with v1.5 between two WARP v3 kits: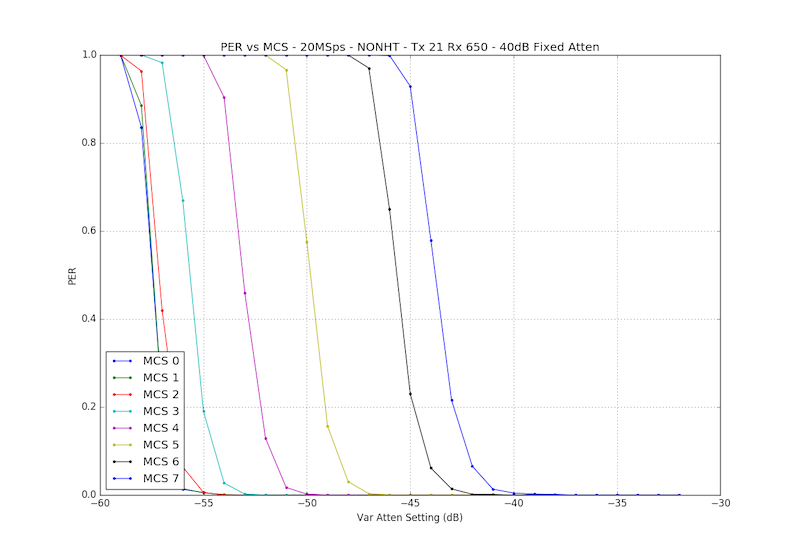
The X axis is the variable attenuator setting. The total attenuation is 47 dB larger (I had 40 dB fixed attenuation in series with the variable attenuator, plus the variable attenuator has ~7 dB insertion loss). The Tx node was configured for 15 dBm Tx power. Together this means the X axis spans approx -92 to -62 dBm Rx power (i.e. from (+15 - (60 + 47)) to (+15 - (30 + 47)) ). Compare that to our previous characterization and you'll notice a multi-dB shift in PER curves.
I want to emphasize these are uncalibrated tests (i.e. I set the Tx power to 15 dBm but did not calibrate the kit's actual Tx power; I trust the variable attenuator, but did not actually measure it's output with test equipment here; etc.).
You'll also notice the near overlap of PER curves for the lowest MCS. This indicates the default settings in the ref design result in detection-limited performance at low SNR, not bit-error-limited performance. You can make the Rx PHY more sensitive to low-SNR receptions by increasing the initiaal AGC gain (last argument to wlan_agc_set_config() in wlan_agc_config()) or by decreasing the packet detection thresholds (currently set in set_phy_samp_rate() in wlan_mac_low.c. Either would increase the probability of detecting low-SNR receptions. This is good for sensitivity testing, but arguably bad for normal network operation, where attempting to receive very-low-SNR waveforms effectively increases the interference footprint of every device, decreasing spatial reuse.
Offline
#5 2016-May-23 01:14:24
- satlab
- Member
- Registered: 2015-Jul-09
- Posts: 9
Re: phy performance of 802.11 ref design 1.5.1
thanks for your efforts, the phy performance is quite perfect in this version :-)
Offline
#6 2016-Nov-28 10:57:01
- ofka3419
- Member
- Registered: 2015-Nov-20
- Posts: 13
Re: phy performance of 802.11 ref design 1.5.1
Not meaning to hijack this thread but this seemed like the most sensible place to post.
We have repeated similar calibration tests to those you performed in 2014 (Which version was this?) on version 1.5.4 using a Keysight M8190A to playback 1000 byte frames generated by the WARP TxPhy in simulation mode. This was upconverted and power controlled by a Keysight E8267D RF modultor/upconverter.
Using the experiments framework and VISA commands to the Keysight kit we repeated 500 frames at each MCS in 0.01dBm steps over the range -60 -> -90dBm.
Plotting FCS good at 1dBm resolution
This also shows that MCS 0-2 overlap as you describe above.
Plotting FCS good at 0.01dBm resolution
Are you able to help explain the steps. Is this due to the AGC stepping the three gains in the LNA stage?
What we do not understand is the plot of all frames (FCS good and bad) below:
Using nomac, the cpu_low should trigger the frame_receive() function for every good SIGNAL the RxPhy detects. This results in a rx log entry regardless of the state of FCS good/bad. Therefore, in the above plot, given than SIGNAL is always transmitted at MCS0, why is there a variation with MCS? Should they not all follow the trace of MCS0 and be near vertical (SIGNAL success or not)?
Offline
#7 2016-Nov-29 02:17:57
- murphpo
- Administrator
- From: Mango Communications
- Registered: 2006-Jul-03
- Posts: 5159
Re: phy performance of 802.11 ref design 1.5.1
Thanks for sharing these plots.
Are you able to help explain the steps. Is this due to the AGC stepping the three gains in the LNA stage?
I don't think it's AGC. The LNA (RF gain) only has 3 levels spaced ~15dB. The VGA (baseband gain) has ~2dB steps. I suspect the steps in your PER curves don't correspond to AGC gain selections. You can verify this by looking at the 'rf_gain' and 'bb_gain' fields in the RX_OFDM entries.
Are you sure your signal generator is actually varying the output power in 0.01dB steps? Or is it quantizing the power value to the nearest dBm? You could verify this by capturing its transmission with a WARPLab node configured for fixed Rx gains.
Using nomac, the cpu_low should trigger the frame_receive() function for every good SIGNAL the RxPhy detects. This results in a rx log entry regardless of the state of FCS good/bad. Therefore, in the above plot, given than SIGNAL is always transmitted at MCS0, why is there a variation with MCS? Should they not all follow the trace of MCS0 and be near vertical (SIGNAL success or not)?
These plots are really interesting. I agree it's odd that an "any FCS" curve should depend on MCS. I need to think about this one.
Two initial thoughts:
-What happens if you the RX_OFDM entries to include only packets with the expected MCS and Length values (the two values in the SIGNAL field)? The SIGNAL field is not well protected- it has a single parity bit, so the Rx PHY can declare "good" SIGNAL even when there were bit errors in the length or rate fields. These events will eventually be declared bad FCS.
-It's curious that the BPSK and QPSK rates (MCS 0-3) overlap, while the 16/64 QAM rates do not. Does anything change if you reduce the digital scaling (the "2.0" values in the REG_TX_Output_Scaling register) when generating the I/Q waveforms for your signal generator?
Offline
#8 2016-Nov-30 09:07:50
- ofka3419
- Member
- Registered: 2015-Nov-20
- Posts: 13
Re: phy performance of 802.11 ref design 1.5.1
Yes, you were correct, although the signal generator can and should have been decreasing in 0.01dBm steps - It wasn't... Here is a 0.1dBm step plot. 
murphpo wrote:
What happens if you the RX_OFDM entries to include only packets with the expected MCS and Length values (the two values in the SIGNAL field)? The SIGNAL field is not well protected- it has a single parity bit, so the Rx PHY can declare "good" SIGNAL even when there were bit errors in the length or rate fields. These events will eventually be declared bad FCS.
We detect very few occurrences of this, at most 2% of measurements at MCS7. I guess it is fairly unlikely since only half of the 2^4 rate combinations are valid, half of errors here immediately result in bad SIGNAL. This means the 'any FCS' plot doesn't look much different, albeit smoother with 0.1dBm steps.
We've not tried reducing the 2.0 scaling factor.
Offline