| Version 5 (modified by chunter, 9 years ago) (diff) |
|---|
Packet Detection Minimum Power Characterization
The Mango 802.11 Reference Design has a feature to set a minimum packet detection power. By doing so, a user can specify a minimum required power that must be present before the PHY will attempt to decode a packet. Raising this power requirement can make a receiver intentionally "more deaf." This parameter can be very useful in experiments for eliminating difficult-to-reproduce low-level interference from other Wi-Fi networks. If a user knows that their devices in the experiment are close to one another, they can raise this threshold to keep their receivers from attempting to decode other distant interferers. This is not universally a good idea -- if the research question a user is trying to answer relies on the presence of weak interferers, then this feature may not be appropriate.

|
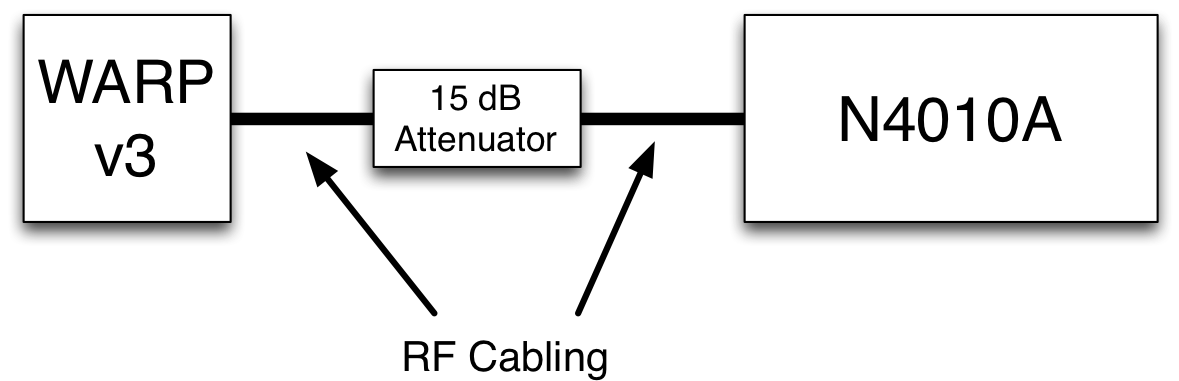
| Experimental Setup |
In this section, we characterize the effect of this feature. As with several of our other characterizations, we use the Keysight N4010A to generate traffic at set power levels.
Methodology
- Construct PPDU waveforms in MATLAB that have the following characteristics:
- 6 Mbps PHY rate (the most reliable OFDM rate)
- 1000 octet PPDU length (i.e., a 972 byte payload + 14 byte MAC header + 4 byte FCS)
- 10 different scrambling sequence start points to generate waveforms with different peak-to-average-power (PAPR) features
- Load each waveform in to the N4010A's volatile memory as segment files.
- Sweep different minimum packet detection power thresholds. For each value:
- Sweep Rx powers in the N4010A.
- Create N4010A sequence files that send each waveform segment 1000x in a row
- Use WLAN Experiments Statistics to determine how many of the transmissions were fully received with a good FCS.
- Sweep Rx powers in the N4010A.
Results
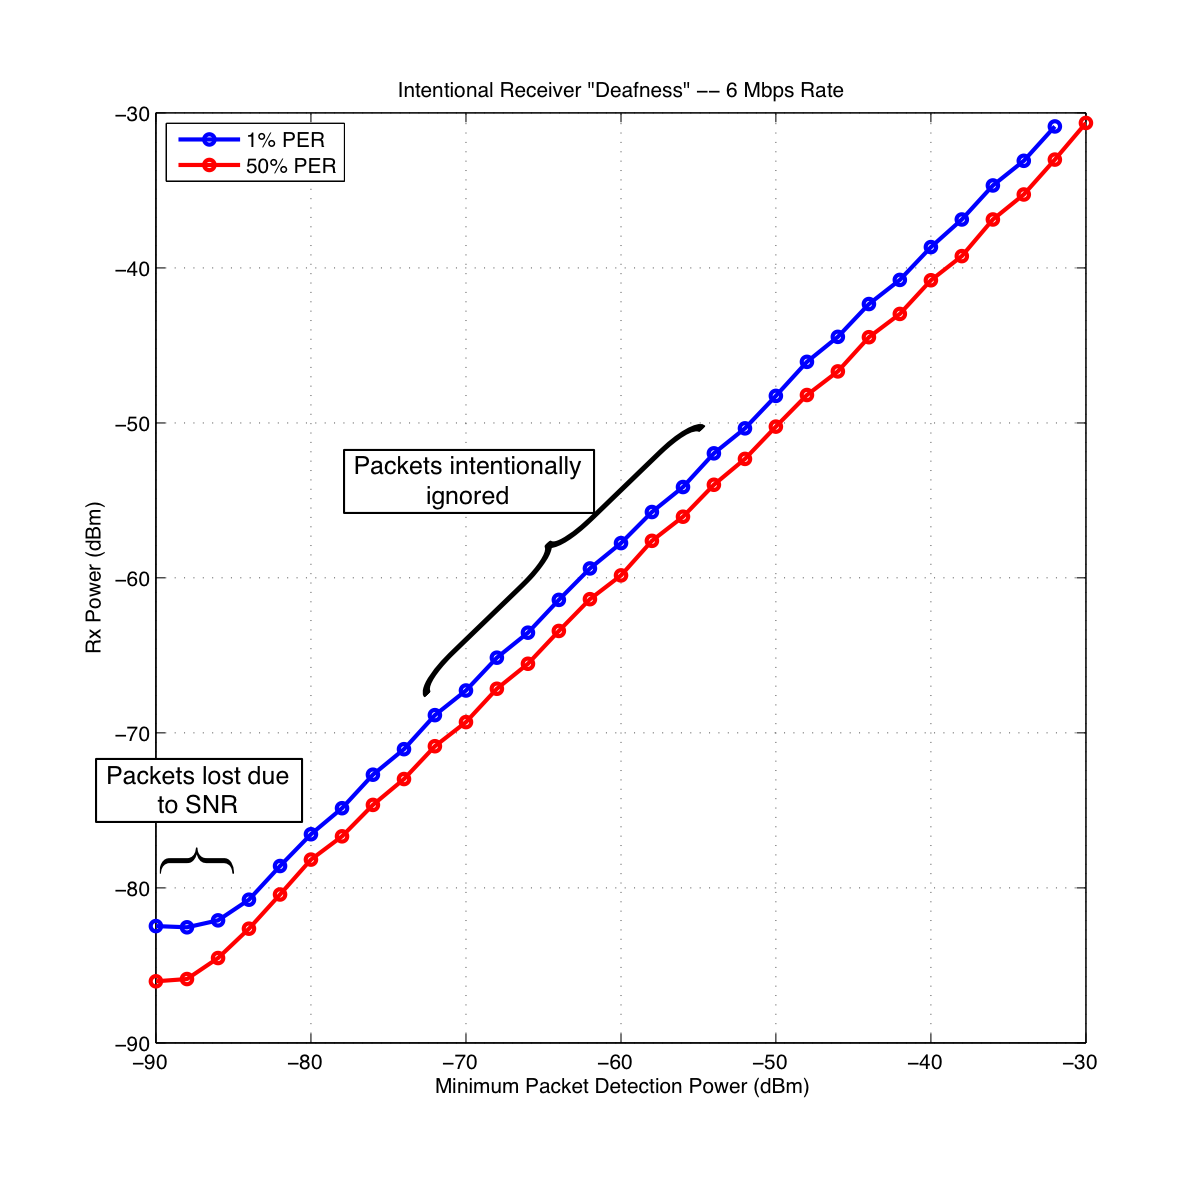
Each tuple of (Rx Power, Minimum Packet Detection Power) produces some measurable packet error rate (PER). Using wlan_exp, we have traces a fixed PER through this (Rx Power, Minimum Packet Detection Power) space.

|
The above figure shows a 10% PER curve and a 1% PER curve as a function of minimum packet detection power. In the leftmost region of the plot where the PER curves "flatten out," the PER of the link is dominated by noise. In other words, the minimum packet detection power is set at powers lower than the PHY can receive a packet anyway. At a certain point, an increased minimum packet detection power does begin to affect reception because packets received weaker than that threshold are ignored. As such, the PER curve increases with a slope of 1dB per dB.
The 1% PER curve is plotted alongside the 10% PER curve in order to demonstrate
Attachments (2)
- setup.png (46.3 KB) - added by chunter 9 years ago.
- rx_pkt_det_min_power.png (142.1 KB) - added by chunter 9 years ago.
Download all attachments as: .zip