| Version 5 (modified by chunter, 10 years ago) (diff) |
|---|
IBSS (ad hoc) with Multiple Traffic Flows
This application is an extension to the Investigating Physical Carrier Sensing in the DCF with Multiple Traffic Flows application note. Instead of a network of 1 AP and 2 STA nodes, this example shows how to run an experiment with 3 IBSS nodes.
The standard AP/STA flavors of 802.11 have a fundamental limitation: The AP is capable of transmitting to any of its association stations, but the STA devices can only directly transmit to the AP. STA devices cannot directly communicate with other STA devices on the BSS without first hopping through the AP.
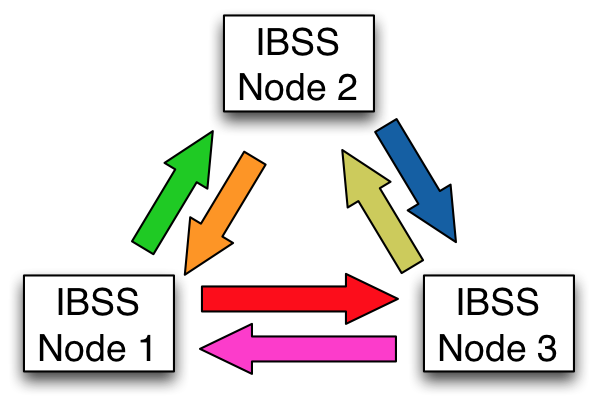
IBSS devices are different. The "Independent Basic Service Set" allows for any device to communicate to any other device, allowing for more general mesh configurations. Unlike the Investigating Physical Carrier Sensing in the DCF with Multiple Traffic Flows application note, we are not limited to a total of 4 possible flows. In this application note, we extend the network to a total of 6 flows while still only using 3 IBSS nodes.
Experiment Details
- Packet Length: 1400 byte payloads (1428 byte MPDUs, with MAC header and FCS)
- PHY Rate: 18 Mbps (QPSK, code rate 3/4)
- Tx Power: -5 dBm
- Trial Duration: 300 seconds
- 2.4GHz channel 6
We use 6 traffic flows in our experiments:
- Flow 1: Backlogged traffic from IBSS_1 to IBSS_2
- Flow 2: Backlogged traffic from IBSS_1 to IBSS_3
- Flow 3: Backlogged traffic from IBSS_2 to IBSS_1
- Flow 4: Backlogged traffic from IBSS_2 to IBSS_3
- Flow 5: Backlogged traffic from IBSS_3 to IBSS_1
- Flow 6: Backlogged traffic from IBSS_3 to IBSS_2

Tx/Rx Log Results
The 802.11 Reference Design experiments framework includes a flexible logging system that runs in real-time at every node. This system keeps a record of every Tx and Rx event at the node. For Tx events the log includes both the high-level MPDU Tx (as implemented in CPU High) and the low-level PHY Tx events for each MPDU. Each low-level Tx record includes the timestamp of the actual PHY transmission plus MAC parameters for the transmission (number of backoff slots, current contention window, re-transmission count, etc.). By retrieving the logs from every node following the experiment and analyzing them together, we can gain significant understanding of the behaviors of the nodes and how various parameters impact performance on short and long timescales.
| Throughput vs. Time | Throughput Histogram |
|---|---|
 | 
|
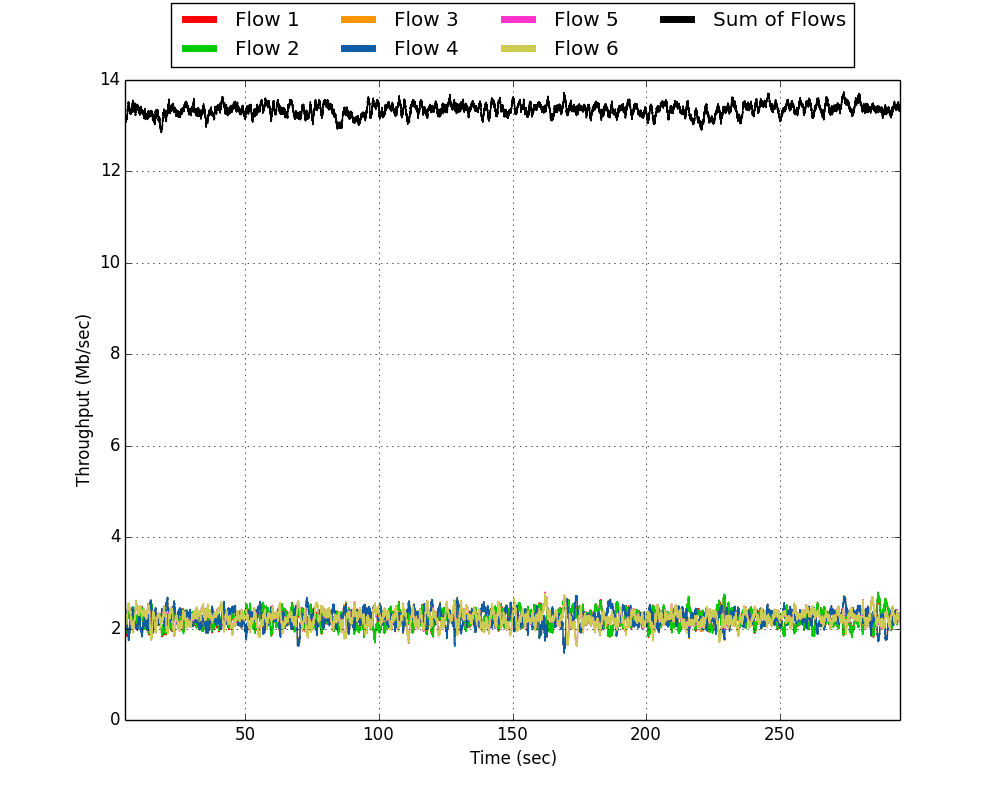
The above figures show 300 seconds of data from the experiment. In the first figure, the black line shows the total sum throughput that was sustained in the network. The ~12.5Mbps that was achieved is just slightly below the theoretical max throughput that can be achieved at the 14Mbps PHY rate. The slight reduction is due to the overhead of the DCF along with unavoidable collisions among the 6 traffic flows.
Attachments (4)
- topology.png (45.6 KB) - added by chunter 10 years ago.
- xput_hist.png (144.1 KB) - added by chunter 10 years ago.
- xput_vs_time.png (84.5 KB) - added by chunter 10 years ago.
- multi-flow_ibss_python_scripts_v_1_00.zip (9.4 KB) - added by chunter 10 years ago.
Download all attachments as: .zip