First we import the required packages:
import warpnet.wlan_exp_log.log_util as log_util
import warpnet.wlan_exp_log.log_util_hdf as hdf_util
import numpy as np
Next define the names of the two log files we will process:
AP_LOGFILE = 'example_logs/ap_log_stats_2014_03_20.hdf5'
STA_LOGFILE = 'example_logs/sta_log_stats_2014_03_20.hdf5'
Then we extract the log data and the associated log indexes from the log files:
log_data_ap = hdf_util.hdf5_to_log_data(filename=AP_LOGFILE)
log_data_index_ap = hdf_util.hdf5_to_log_data_index(filename=AP_LOGFILE)

log_data_sta = hdf_util.hdf5_to_log_data(filename=STA_LOGFILE)
log_data_index_sta = hdf_util.hdf5_to_log_data_index(filename=STA_LOGFILE)
Before we can process the log data, we need to translate and filter the raw log indexes. This step replaces the hard-to-understand entry type codes (like 10) with easy entry type names (like RX_OFDM). It also filters out log entries we don't need for this example.
In this example we create log indexes (one for each log file) that refer to only the Tx and OFDM Rx log entries:
log_index_txrx_ap = log_util.filter_log_index(log_data_index_ap, include_only=['RX_OFDM', 'TX'])
log_index_txrx_sta = log_util.filter_log_index(log_data_index_sta, include_only=['RX_OFDM', 'TX'])
Finally we parse the actual log data, extracting arrays for each type of log entry in our filtered index:
log_np_ap = log_util.log_data_to_np_arrays(log_data_ap, log_index_txrx_ap)
log_np_sta = log_util.log_data_to_np_arrays(log_data_sta, log_index_txrx_sta)
Now we have four numpy arrays (Tx/Rx for AP/STA), stored in two dictionaries. Let's assign these arrays to dedicated variables for easier code:
tx_ap = log_np_ap['TX']
tx_sta = log_np_sta['TX']

rx_ap = log_np_ap['RX_OFDM']
rx_sta = log_np_sta['RX_OFDM']
Now that we have the individual arrays, let's see how many entries each has:
print('AP Rx: {0}, AP Tx: {1}'.format(len(rx_ap), len(tx_ap)))
print('STA Rx: {0}, STA Tx: {1}'.format(len(rx_sta), len(tx_sta)))
This will print AP Rx: 318628, AP Tx: 298222 and STA Rx: 302648, STA Tx: 312515. Clearly there are many Tx and Rx events.
Let's figure out how much time elapsed between the first and last reception at the STA:
t0 = rx_sta['timestamp'][0]
t1 = rx_sta['timestamp'][-1]
print('STA Rx Timespan: {0} seconds'.format( (t1-t0)/1E6 ))
This will print STA Rx Timespan: 498.055775 seconds. Looks like the logs have ~8 minutes worth of data.
Next let's check out the distribution of rates for packets received at the AP.
print(np.bincount(rx_ap['rate']))
This will print [ 0 22337 19696 27653 36418 46428 58915 69641 37540].
The MAC code encodes rates as integers 1 to 8 (for 6 to 54 Mbps).
The numpy bincount method counts the number of each unique value in the input vector, returning the count for every value from 0 to the highest value. Thus, the vector rx_ap['rate'] had 8 unique values (integers 1 to 8). The zero in the output array indicates the value 0 did not occur in the input.
So we can clearly see the AP received more packets at higher rates.
Let's look at the distribution of rates vs time to see if we can understand why.
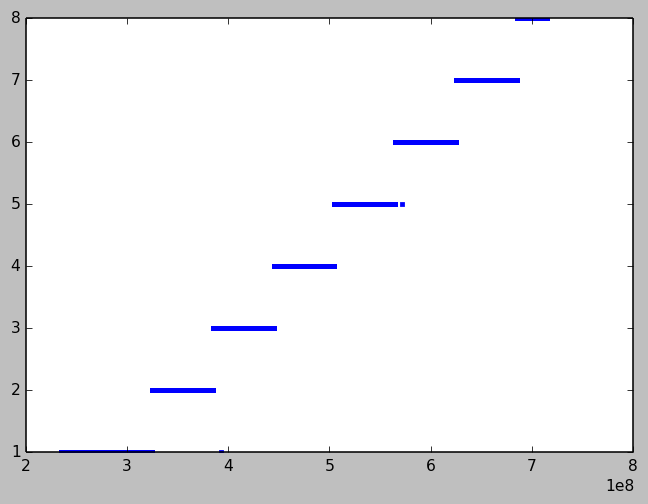
plot(rx_ap['timestamp'], rx_ap['rate'],'.')
This will produce a plot:

The X-axis is the Rx timestamp in microseconds. The Y-axis the rate value (integers in 1 to 8). There's a clear pattern- each rate was used for a fixed interval. But how long?
rx_ap_idx_7 = (rx_ap['rate'] == 7)
first_r7 = min(rx_ap['timestamp'][rx_ap_idx_7])
last_r7 = max(rx_ap['timestamp'][rx_ap_idx_7])

print('{0} seconds'.format( (last_r7 - first_r7)/1E6 ))
This will print 60.005337 seconds. So the experiment used each rate for about 1 minute.
Notice the indexing trick in the code above. The variable rx_ap_idx_7 contains booleans indicating which elements passed the test, True here for receptions with rate of 7. This boolean array is then used as the slice argument to the timestamp array to select only the rate = 7 entries. Using a boolean array as a slice argument is a very fast way to filter a numpy array for further processing.
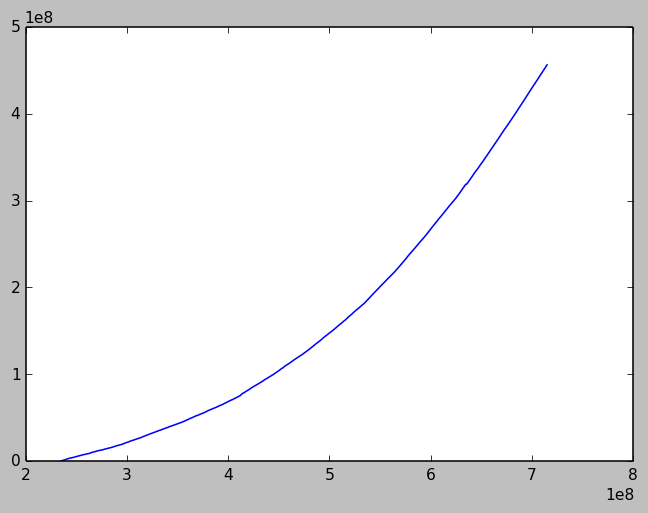
Another way to visualize the increasing rates is to plot the cumulative number of bytes received by one node. The rate of bytes-per-time (i.e. throughput) should be faster with increasing rate.
rx_ap_lens_acc = np.cumsum(rx_ap['length'])
plot(rx_ap['timestamp'], rx_ap_lens_acc)
This will produce a plot:

Clearly the rate of bytes-per-time is increasing with time, consistent with our earlier observation of rates vs. time. It's also clear the AP received an impressive 456 MB of data in this experiment.
Attachments (2)
- wlan_exp_log_txrx_ex_t_vs_rate.png (8.5 KB) - added by murphpo 10 years ago.
- wlan_exp_log_txrx_ex_t_vs_bytes.png (15.7 KB) - added by murphpo 10 years ago.
Download all attachments as: .zip