Channel Characterization
Most of these videos were edited using Apple's Final Cut Studio. To view the source video files (the ".mov" files linked below), you will need Apple's free QuickTime software. All of the embedded videos here use the excellent JW FLV Media Player. To view the embedded videos, you need a recent version of the Adobe Flash Player browser plugin
Channel Characterization
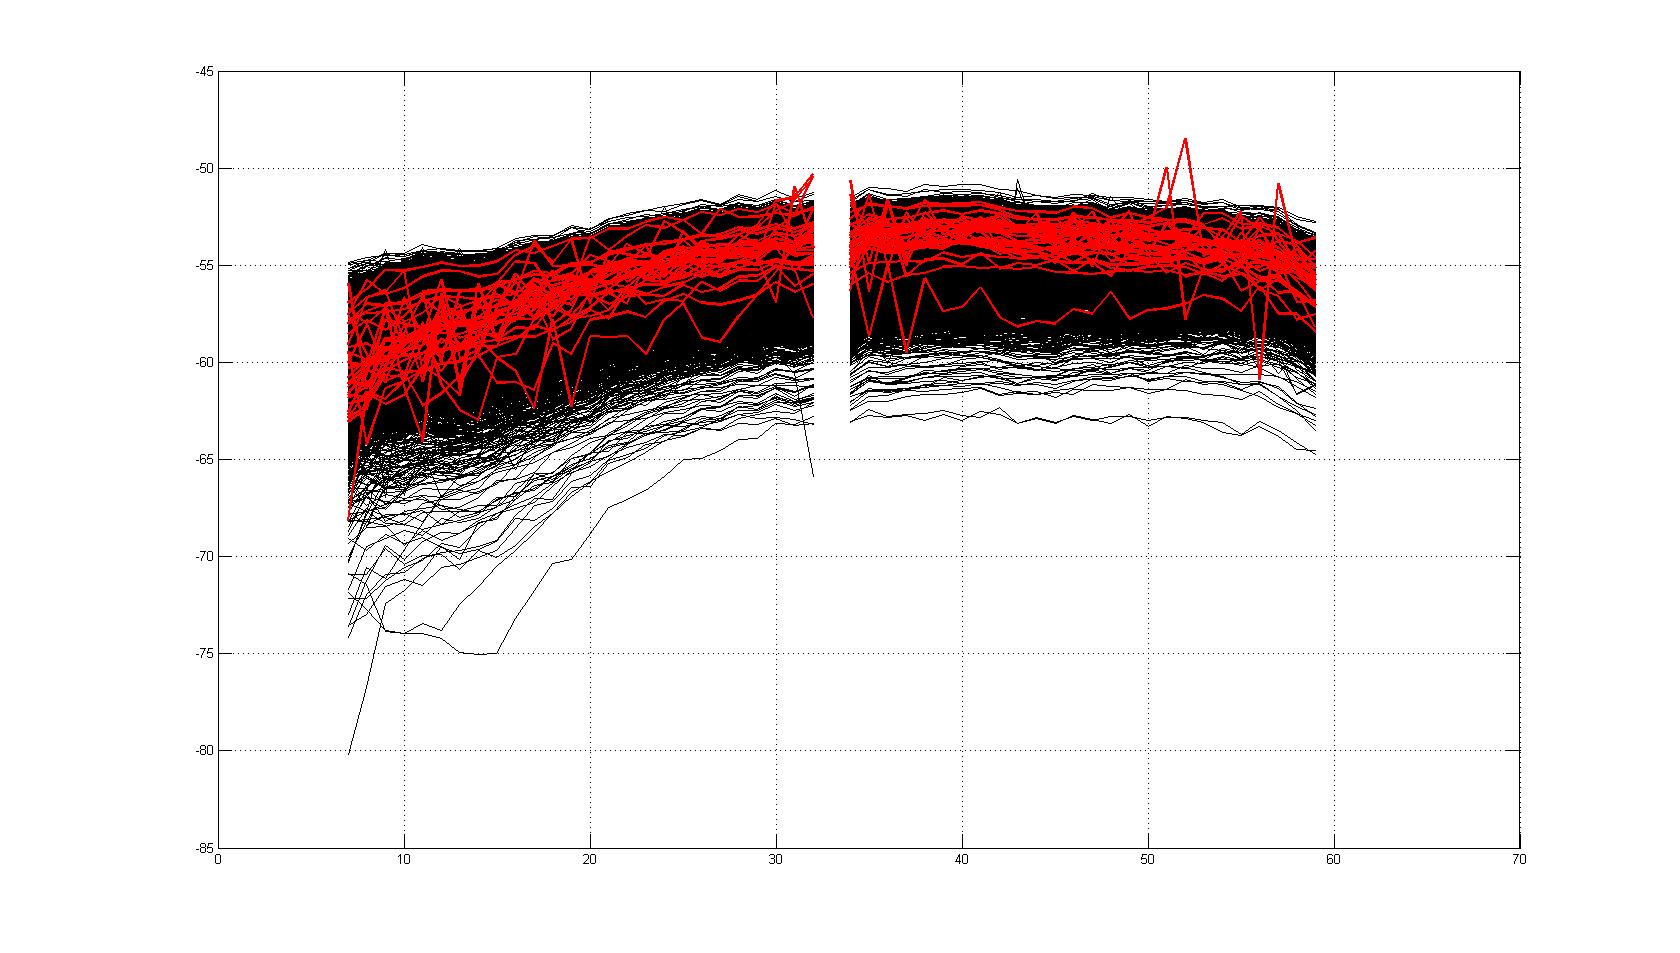
Figures 1 - 7000 Packets
The following video demonstrates good and bad packets. Black signifies a good packet. Red signifies a bad packet.
Download source video file: figure_1.mov (54MB)
Figures 1 Image - 7000 Packets
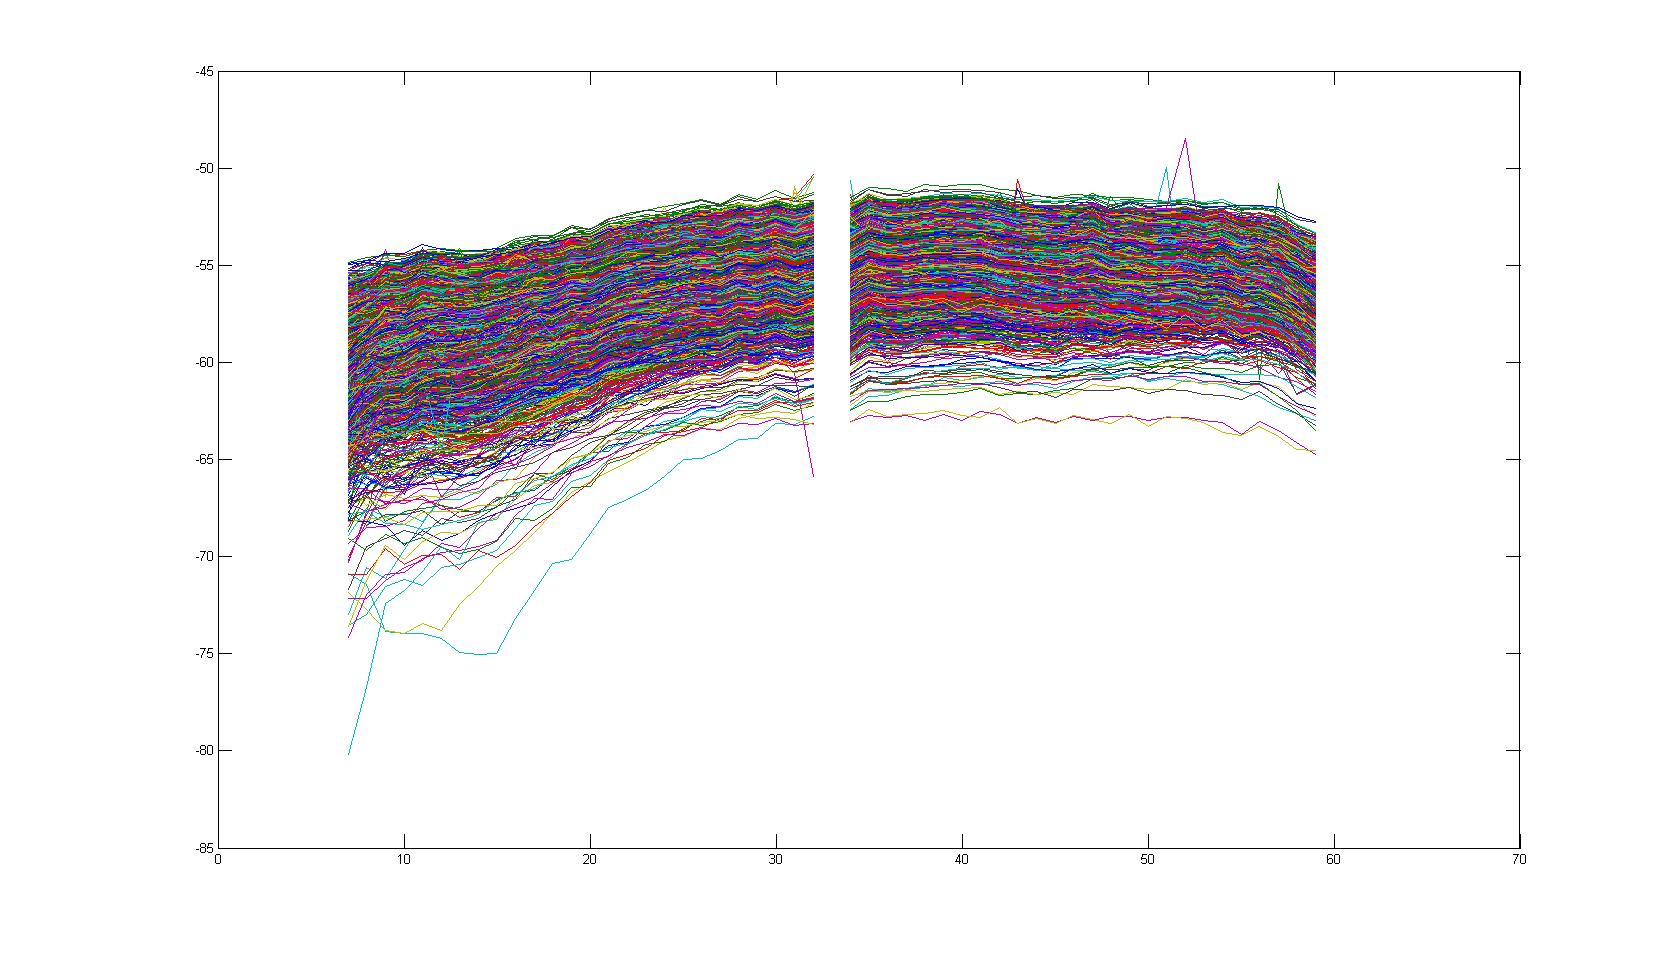
Figures 2 - 7000 Packets
The following video demonstrates each packet, regardless of good or bad.
Download source video file: figure_2.mov (60MB)
Figures 2 Image - 7000 Packets
The data used in this program: PacketData_7000.m (60MB)
The m-file for creating these videos: step_plotter.m
The m-file for creating these images: plotter.m
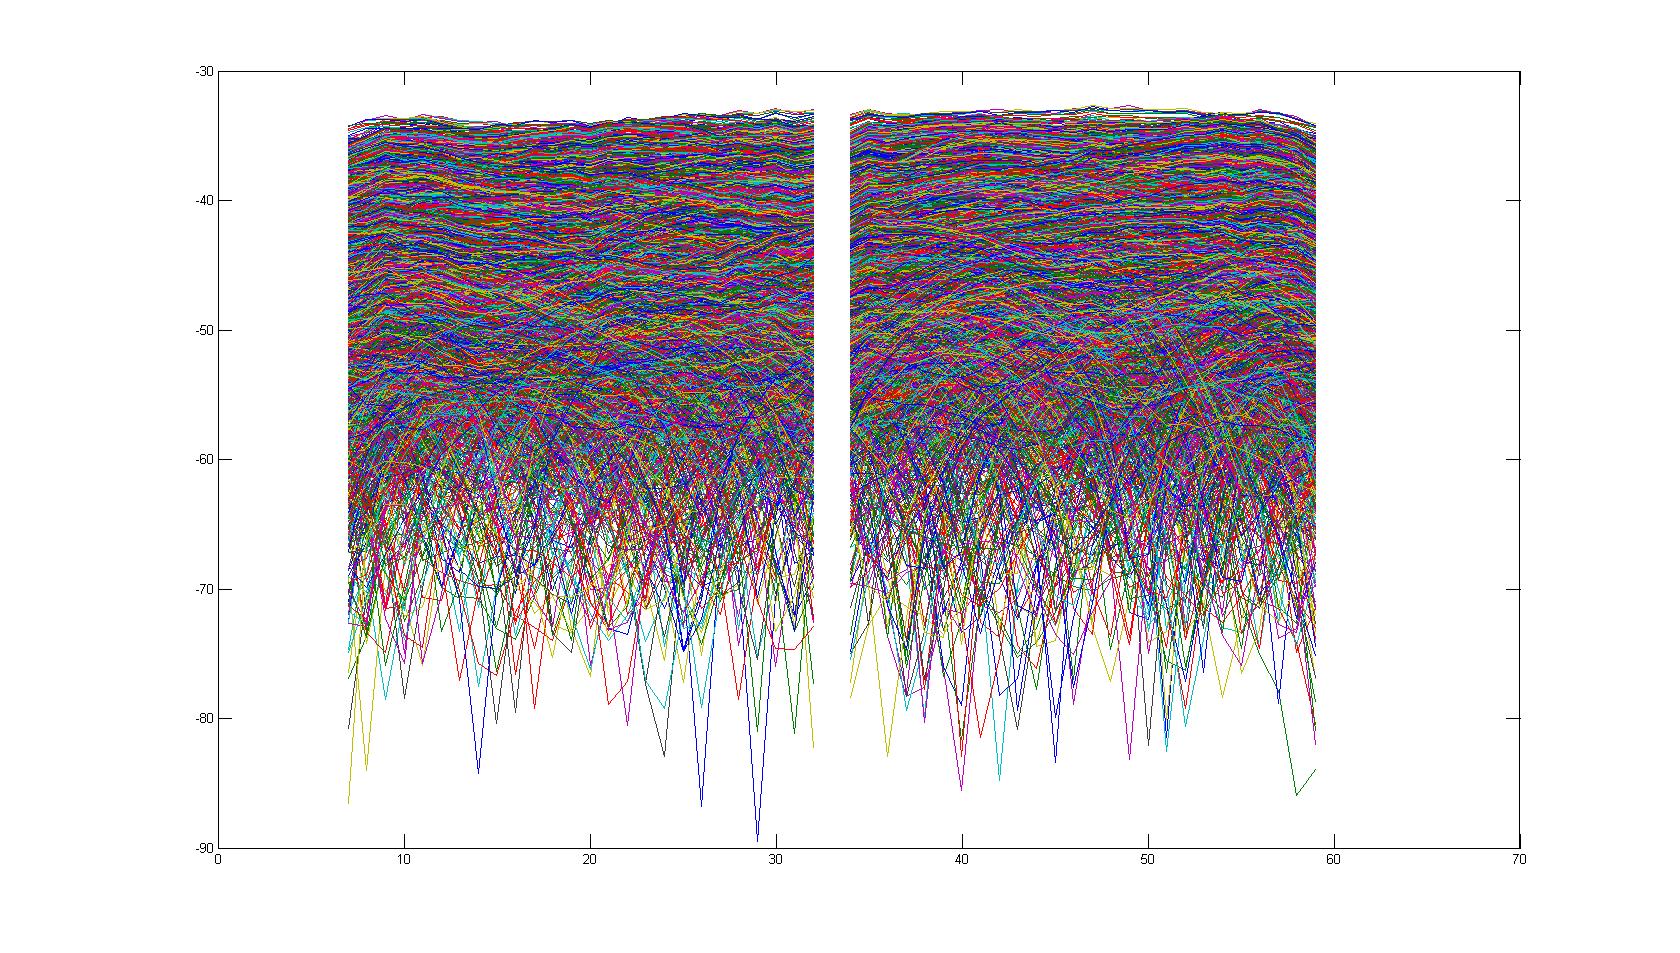
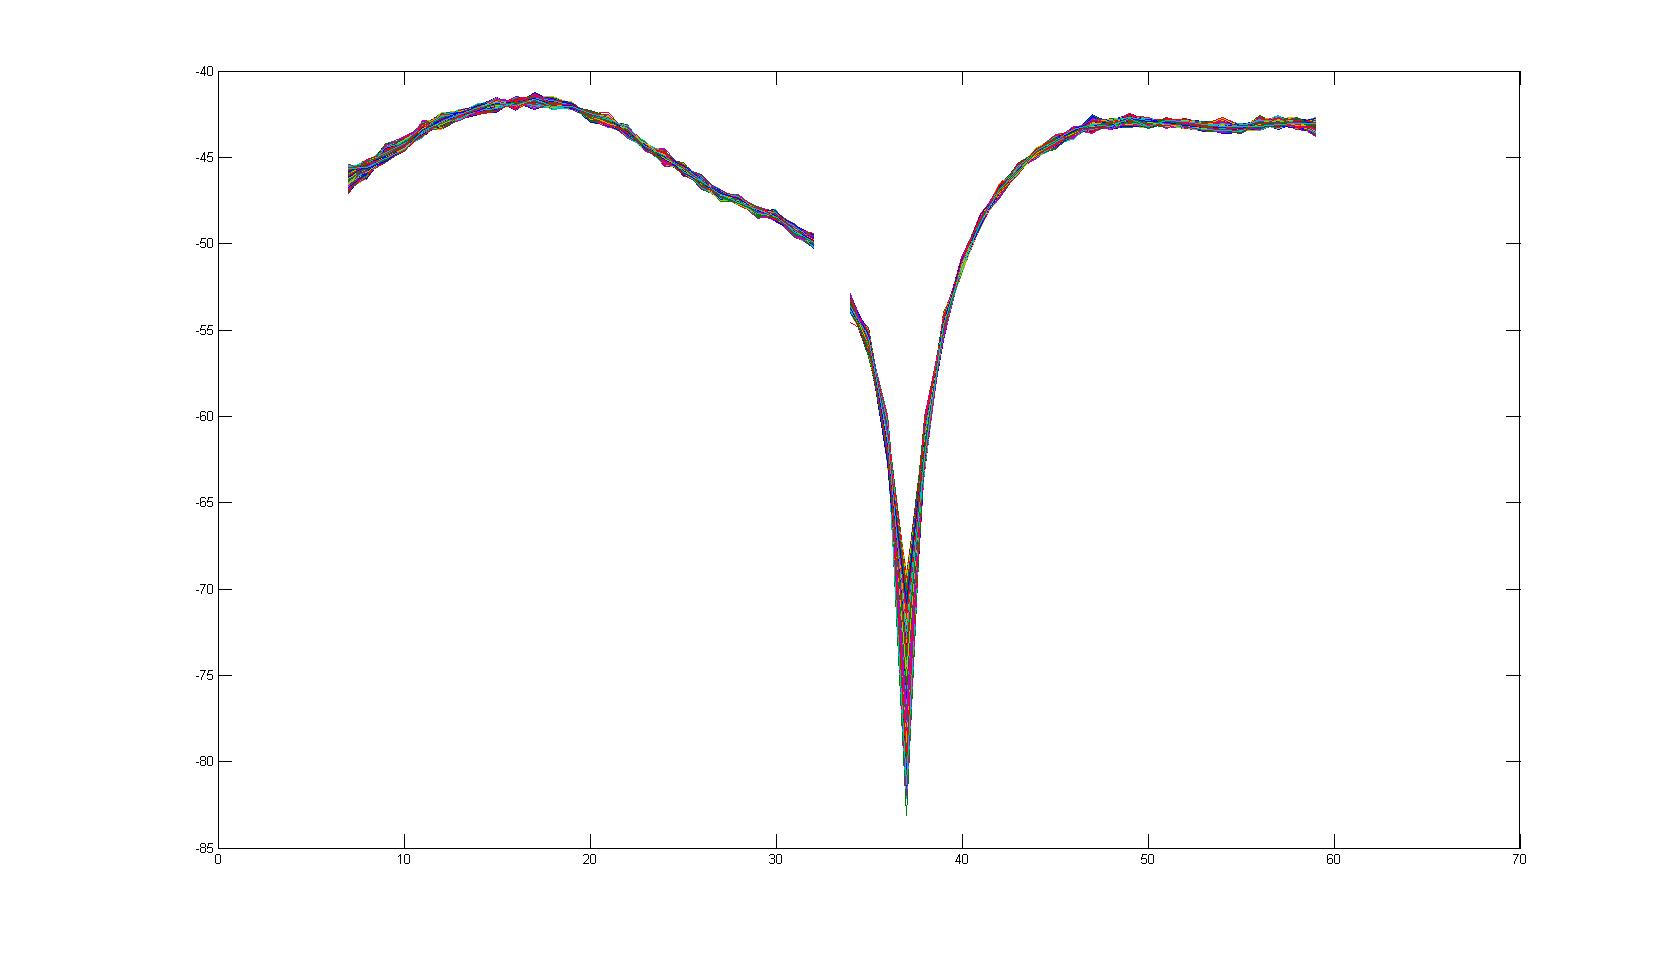
ACE Emulator, Pedestrian A - 10,000 Packets
The below figure is for Velocity 0 km/h in the ACE emulator

The below figure is for Velocity 25 km/h in the ACE emulator
Download Pedestrian A m-file: Pedestrian_A.zip (50 MB)
This contains data PacketInfo_Vel#.m for the emulation with velocities of 0, 25, 50, 75, 100, 125, 150, 175, 200, 225, 250, 275 km/h, file new_plotter.m for plotting time differences between packets received and for comparing frequence against db, and a file load_data.m which loads all files and plots all files.
ACE Emulator, Vehicle A - 10,000 Packets
Download Vehicle A m-file: Vehicle_A.zip (50 MB)
This contains data PacketInfo_Vel#.m for the emulation with velocities of 0, 25, 50, 75, 100, 125, 150, 175, 200, 225, 250, 275 km/h, file new_plotter.m for plotting time differences between packets received and for comparing frequence against db, and a file load_data.m which loads all files and plots all files.
When loading a PacketInfo_Vel#.m file, the variables are:
NodeIDs <2x10000>
-1st row is the partner ID
-2nd row is the Antenna ID.
-10,000 is the total number of packets
PacketData <7x10000>
-1st row is time stamp in seconds
-2nd row is time stamp in microseconds
-3rd is goodPackets
-4th is otherBadPackets
-5th is partnerBadPackets
-6th is rxBytes
-7th is txBytes
Sec <1x10000>
-1st row is time stamp in seconds
USec <1x10000>
-1st row is time stamp in microseconds
chanBB <1x10000>
-1st row is chanEstsStruct agc_BB
chanRF <1x10000>
-1st row is chanEstsStruct agc_RF
chanEstsI <64x10000>
-Rows represent chanEstsStruct I component
chanEstsQ <64x10000>
-Rows represent chanEstsStruct Q component
pkStatus <1x10000>
-1st row is the Packet Status
All the specifications for these models may be found at:
ITU ITU-R M.1225, “Guidelines for evaluations of radio transmission technologies for IMT-2000,” 1997.
Some other sites : http://www.cse.wustl.edu/~jain/cse574-08/ftp/j_5phy/sld011.htm
Attachments (5)
- Velocity_0.jpg (56.7 KB) - added by rpl1 15 years ago.
- Velocity_25.jpg (362.9 KB) - added by rpl1 15 years ago.
- Pedestrian_A.zip (49.2 MB) - added by rpl1 15 years ago.
- Vehicle_A.zip (49.5 MB) - added by rpl1 15 years ago.
- Vehicle_A.2.zip (49.5 MB) - added by rpl1 15 years ago.