Xilinx ETS 2014 Demo: Massive MIMO Wi-Fi Channel Characterization
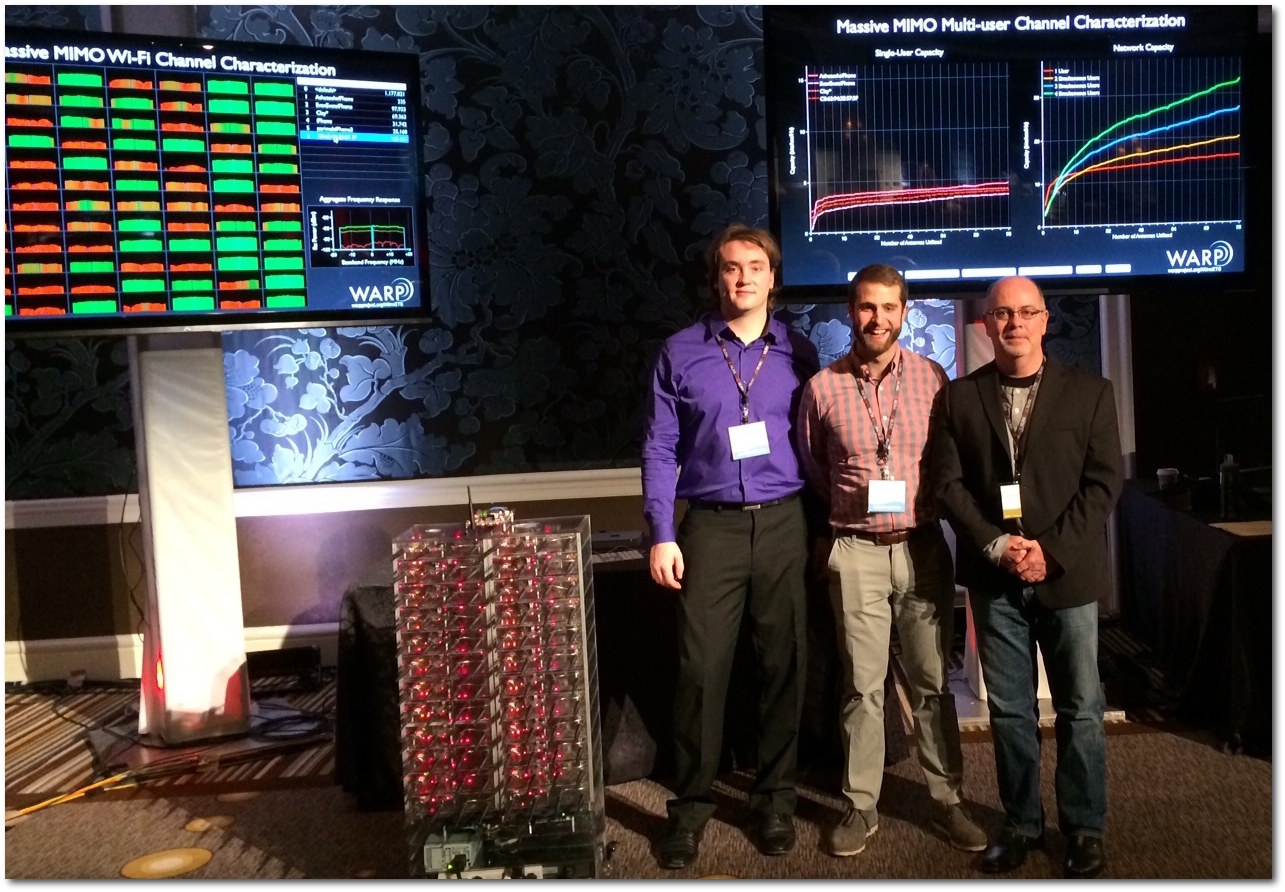
The Rice Argos team partnered with Mango Communications to present a Massive MIMO Wi-Fi Channel Characterization demo at the Xilinx Emerging Technology Symposium 2014. This demo combined the 96-antenna Argos v2 massive MIMO testbed with the Mango 802.11 Reference Design to capture and analyze channel estimates between the array and Wi-Fi clients in real time.

|
| Clay Shepard, Evan Everett (Rice PhD students) and Chris Dick (Xilinx Distinguished Engineer and DSP Chief Architect) |
Demonstration
The demo uses the 96-antenna Argos v2 array. The array uses 24 quad-antenna WARP nodes, each node consisting of a WARP v3 kit and FMC-RF-2X245 module. Each node in the array runs the 802.11 Reference Design in receive-only mode. The array elements receive every Wi-Fi packet, decode the packet to identify the transmitting client, then report the client identity and the corresponding per-subcarrier channel estimates to a host PC for processing and display. All physical layer processing is implemented in real time in the FPGA at each WARP v3 node.

Another WARP v3 kit acts as an 802.11 AP. Client devices, including demo visitors' phones, can join this AP and access the internet via their devices' Wi-Fi connections. The host PC uses the AP's association table to recognize the source of transmissions reported by the array receivers. The visualization program (see below) uses this information to construct a 96x52 (antennas x subcarriers) channel matrix for each user that is updated with every wireless packet reception.
Channel Visualizations
A custom application on the host PC receives the wireless client updates from the AP and channel estimate updates from the array nodes. The application processes these updates and displays the results in real time.
The application has two displays:
Display 1: Real-time plots of channel magnitudes at each array antenna per associated user. Each plot is a bar graph showing the magnitude of 52 complex channel coefficients, one coefficient per subcarrier per antenna. This screen also displays the current association table at the AP. The table lists the associated Wi-Fi clients by hostname and shows the total number of array observations for each user.
Display 2: Real-time plots of wireless capacities based on the latest channel estimates between the array and (up to) four selected clients. There are two plots:
- Single-user Capacity: plots the capacity to each user vs. the number of array antennas used. Each line on this plot approximates the achievable downlink capacity to a single user assuming the array used a subset of its antennas in a conjugate beamforming configuration. The decreasing slope of each capacity curve with increasing antennas clearly demonstrates the diminishing benefit of many antennas with traditional wireless techniques.
- Network Capacity: plots the total network capacity if the array implements downlink multi-user beamforming techniques using a subset of its antennas. The trends on the four plots clearly highlight the benefit of additional antennas when multi-user techniques are employed. The increasing slope when additional users are served highlights the "outside the log" gain in network capacity with multi-user beamforming.
Note: the videos above require an HTML5 capable browser. If the videos do not show you can download the videos directly or view static screenshots:
- Demo display 1: video | screenshot
- Demo display 2: video | screenshot
Video
Watch a video of the demo presentation given by Evan Everett, Rice PhD student under Prof. Ashu Sabharwal:
Note: this video requires an HTML5-compatible browser. If the video doesn't show above try viewing it directly: WARP_ArrrayDemo.mp4
Handouts
More Information
Attachments (8)
- demo_app_screen1_sm.png (122.2 KB) - added by murphpo 10 years ago.
- demo_app_screen1.png (375.0 KB) - added by murphpo 10 years ago.
- demo_app_screen2_sm.png (108.6 KB) - added by murphpo 10 years ago.
- demo_app_screen2.png (197.9 KB) - added by murphpo 10 years ago.
- Mango_802.11_RefDes_Handout.pdf (2.2 MB) - added by murphpo 10 years ago.
- WARP_Array_Demo_BlkDiag.png (82.3 KB) - added by murphpo 10 years ago.
- RiceArgos_Xilinx_ETS_Handout.pdf (1.7 MB) - added by murphpo 10 years ago.
- Argos_Xilinx_Demo_Photo.jpg (475.3 KB) - added by murphpo 10 years ago.