802.11 Reference Design
- Download
- Changelog
- FAQ
- Architecture
Using the Design
Benchmarks
- IFS Calibration
- Throughput
- Transmitter Characterization
- Receiver Characterization
- Pkt. Det. Min. Power Characterization
MAC
Upper-level
Lower-level
- PHY
Experiments Framework
- Packet Flow
- FPGA Architecture
- FPGA Resource Usage
- App Notes
- Other Resources
- License
- Changelog
Investigating Physical Carrier Sensing in the DCF with Multiple Traffic Flows
This application note presents results from a simple experiment using the Mango 802.11 Reference Design and its experiments framework. We use three WARP v3 nodes to build a basic 802.11 network, with one AP and two stations (STA). All three nodes contend for medium access with backlogged traffic flows. The experiments framework enables a detailed study of the performance of each traffic flow, providing insight into the low-level behavior of the 802.11 MAC Distributed Coordination Function (DCF). As the independent variable in our experiments we modify the state of physical carrier sensing at each node. All of the scripts used to run the experiments, process the data and plot figures is available below in the Resources section. Furthermore, the log file data we gathered for these specific plots is available in the same section.
The primary purpose of this app note is to demonstrate the 802.11 Reference Design and its experiments framework, and to highlight the variety of experimental data which can be computed from the Tx/Rx log recorded at each node. This app note is not an exhaustive study of physical carrier sensing. There are many scholarly articles on the physical carrier sensing that provide a much richer theoretical background.
Table of Contents
Experimental Setup
The experiments described below use 3 Mango WARP v3 kits, each running the 802.11 Reference Design (version v1.0), including the WLAN Experimental Framework.
Each node's RF interface is connected to an antenna with a toroidal pattern with 7dBi gain in all horizontal directions (L-Com RE07U-SM). The antennas are positioned within line-of-sight.
The nodes are indoors in a small office environment with limited mobility. The experimental network is sharing its channel with a few lightly-loaded Wi-Fi networks.

|
| Experimental Setup |
Experiment Details
- Packet Length: 1400 byte payloads (1428 byte MPDUs, with MAC header and FCS)
- PHY Rate: 18 Mbps (QPSK, code rate 3/4)
- Tx Power: -10 dBm
- Trial Duration: 300 seconds
- 2.4GHz channel 1
- Physical Carrier Sensing Threshold: approximately -70 dBm, when enabled
We use 4 traffic flows in our experiments:
- Flow 1: Backlogged traffic from AP to STA_1
- Flow 2: Backlogged traffic from AP to STA_2
- Flow 3: Backlogged traffic from STA_1 to AP
- Flow 4: Backlogged traffic from STA_2 to AP
The colors in the figure above are used throughout this app note to denote each flow.
Tx/Rx Log Results
The 802.11 Reference Design experiments framework includes a flexible logging system that runs in real-time at every node. This system keeps a record of every Tx and Rx event at the node. For Tx events the log includes both the high-level MPDU Tx (as implemented in CPU High) and the low-level PHY Tx events for each MPDU. Each low-level Tx record includes the timestamp of the actual PHY transmission plus MAC parameters for the transmission (number of backoff slots, current contention window, re-transmission count, etc.). By retrieving the logs from every node following the experiment and analyzing them together, we can gain significant understanding of the behaviors of the nodes and how various parameters impact performance on short and long timescales.
Rx Power vs. Time
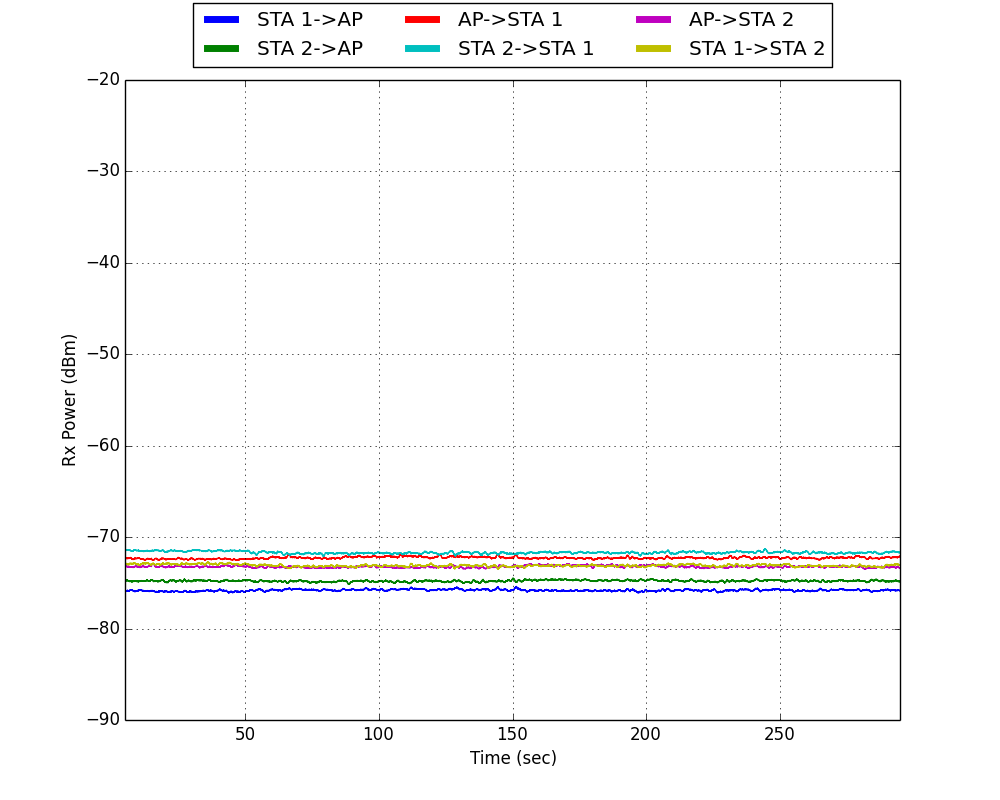
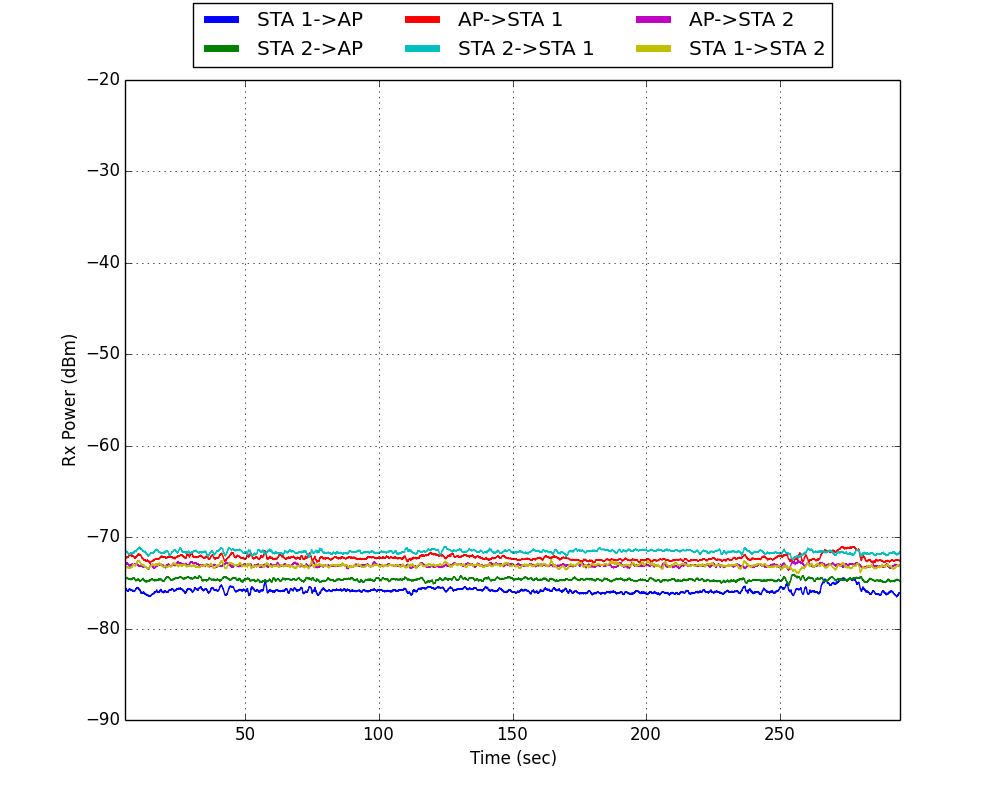
The first log-based analysis simply plots the received power of every packet for each node, grouped by traffic flow.
| Rx Power vs. Time | |
|---|---|
 | 
|
| Physical Carrier Sensing Enabled | Physical Carrier Sensing Disabled |
These plots clearly demonstrate the low-mobility, mid-to-high SNR propagation environment for our experiments. And, as expected, the physical carrier sensing threshold has no substantial impact on Rx power.
Throughput vs. Time
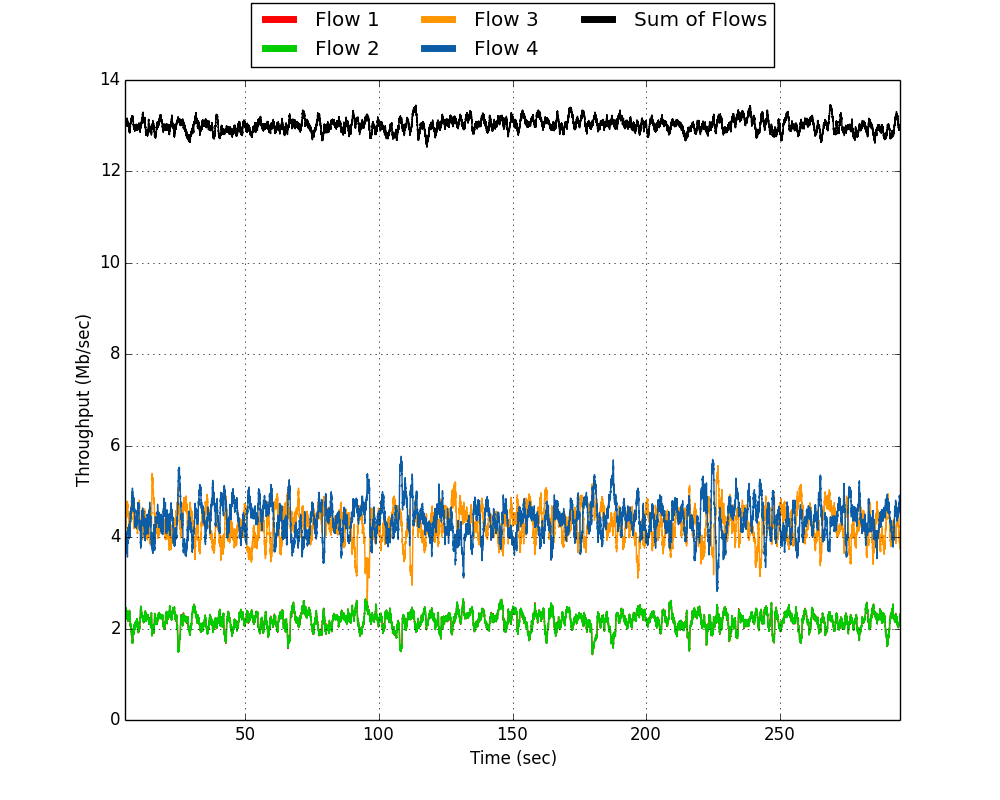
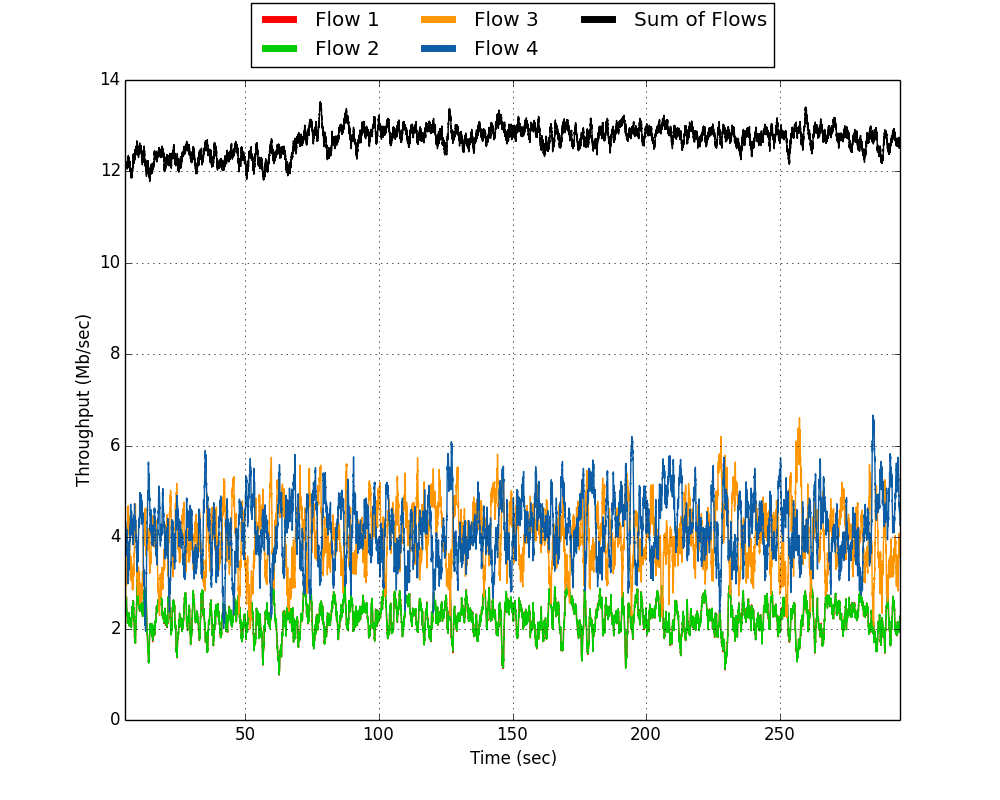
The experiments framework provides an example of measuring aggregate throughput through the use of statistics. While useful for some applications, aggregate throughput does not provide insight into any variations in throughput over the course of the experiment. Using the Rx events in the node logs we can gain a fine-grained view of throughput vs. time.
| Throughput vs. Time Per Flow | |
|---|---|
 | 
|
| Physical Carrier Sensing Enabled | Physical Carrier Sensing Disabled |
These plots show the throughput of each flow as a function of time. Each throughput curve is computed as a 1 second rolling window of bits received by each node for each flow. This 1 second window is rolled over the full 300 second log in steps of 1 msec. This calculation is based on the log throughput analysis example script.
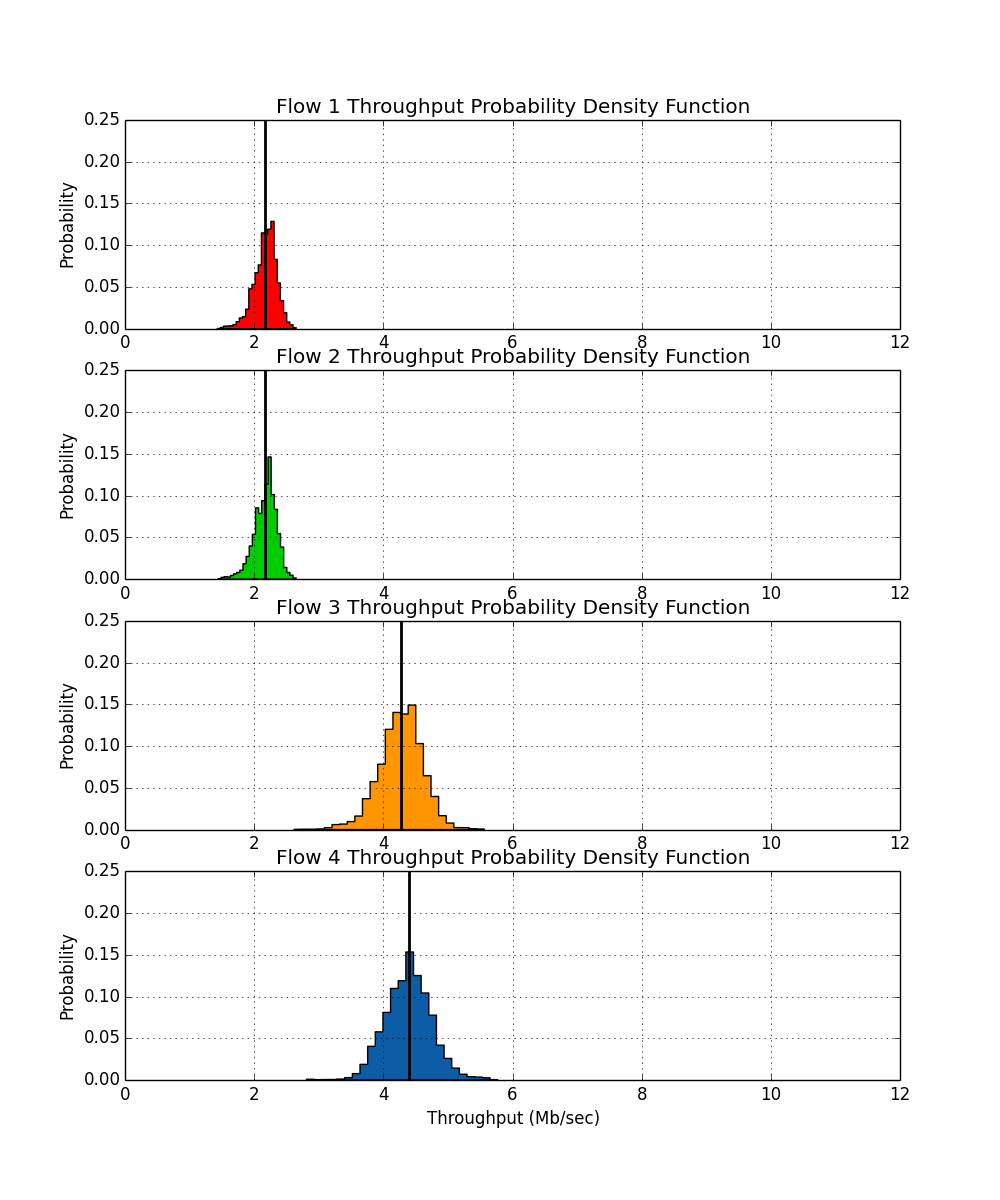
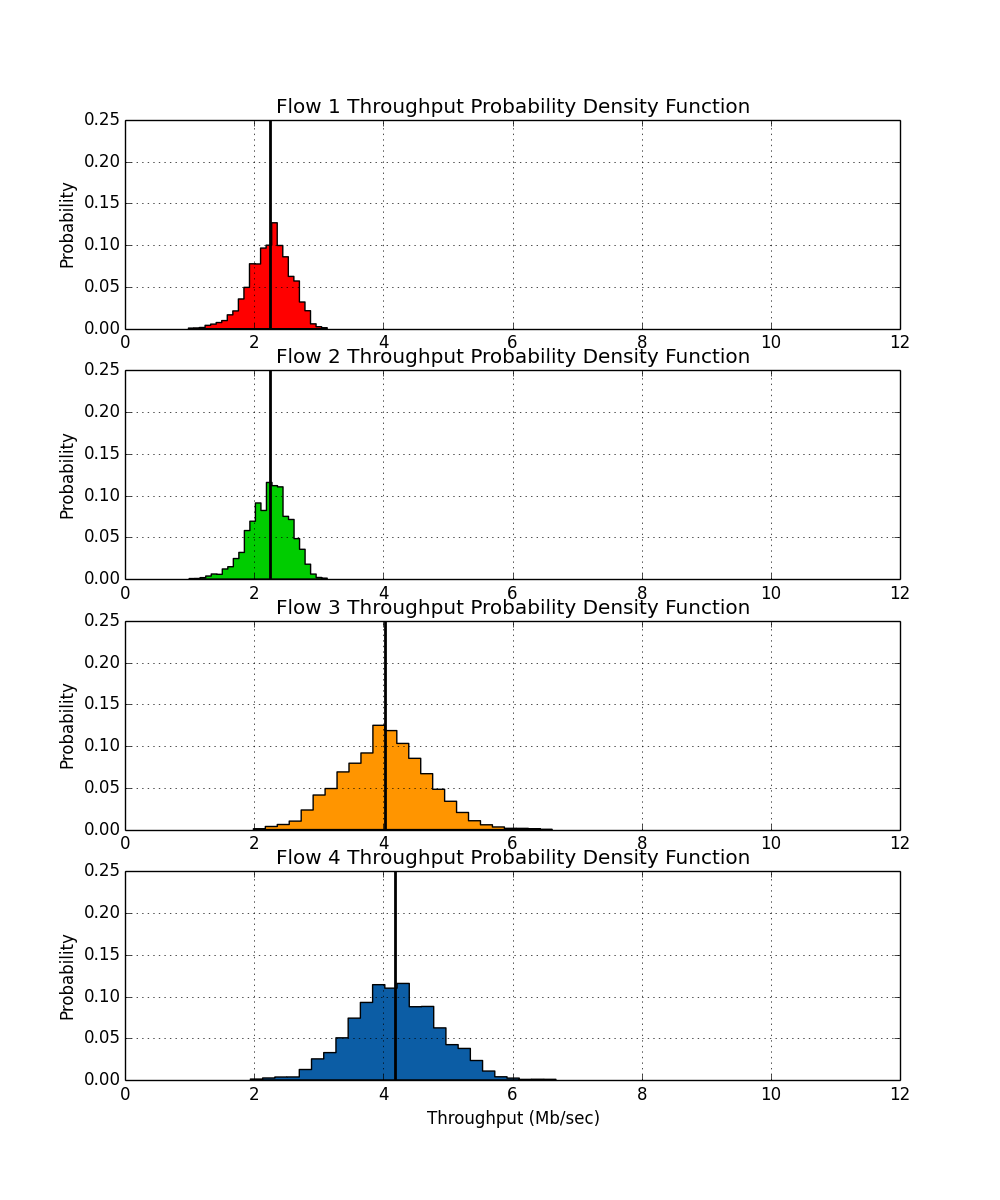
The impact of physical carrier sensing is apparent in the wider variation of instantaneous throughputs achieved by each flow. In a perfectly-coordinated TDMA system there would be zero variation in throughput with time in a high SNR line-of-site environment like this experiment — each flow would be allocated its fair share and would use the medium at specific intervals. Random access (i.e. distributed coordination) adds variation in the instantaneous throughputs. An effective coordination function should minimize these variations. Carrier sensing is designed to detect potential collisions and defer transmissions that would likely fail. These plots clearly demonstrate the improved consistency of throughput when physical carrier sensing is used to defer transmissions. The improvement is visible in both total throughput and in lower variation of individual flow throughputs with time.
| Throughput Histograms Per Flow | |
|---|---|
 | 
|
| Physical Carrier Sensing Enabled | Physical Carrier Sensing Disabled |
These plots use the same data as the throughput vs. time curves above, aggregated as histograms to show the probability density function of short-term throughputs per flow. Ideally each histogram would be a delta function. Again, it's clear physical carrier sensing reduces temporal variations in each flow's throughput.
Contention Windows vs. Time
The 802.11 DCF contention window determines the distribution of available slot counts when selecting a random backoff period. The contention window grows (i.e. longer average backoffs) with each failed attempt to transmit a packet. The contention window growth is exponential, starting at a width of 16 (i.e. [0,15] slots) and doubling with each re-transmission, up to a maximum width of 1024 (i.e. [0, 1023] slots).
Ideally a node's contention window would never increase from 15 (the minimum). In reality packet collisions and losses require re-transmissions, leading to inevitable contention window increases.
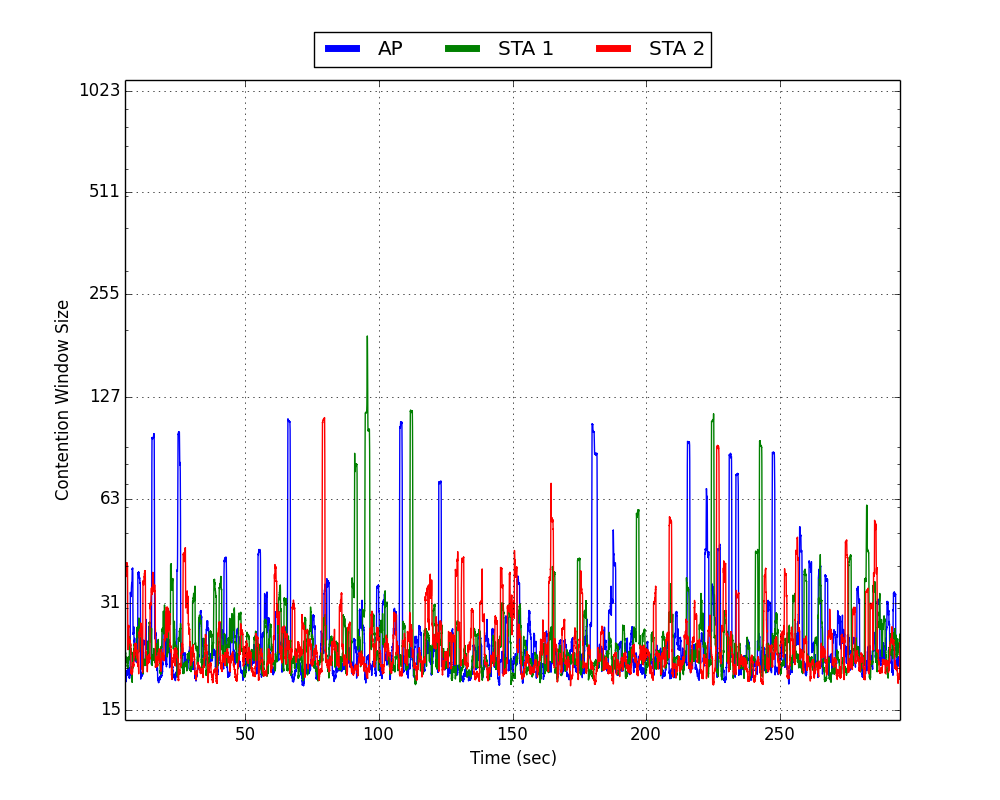
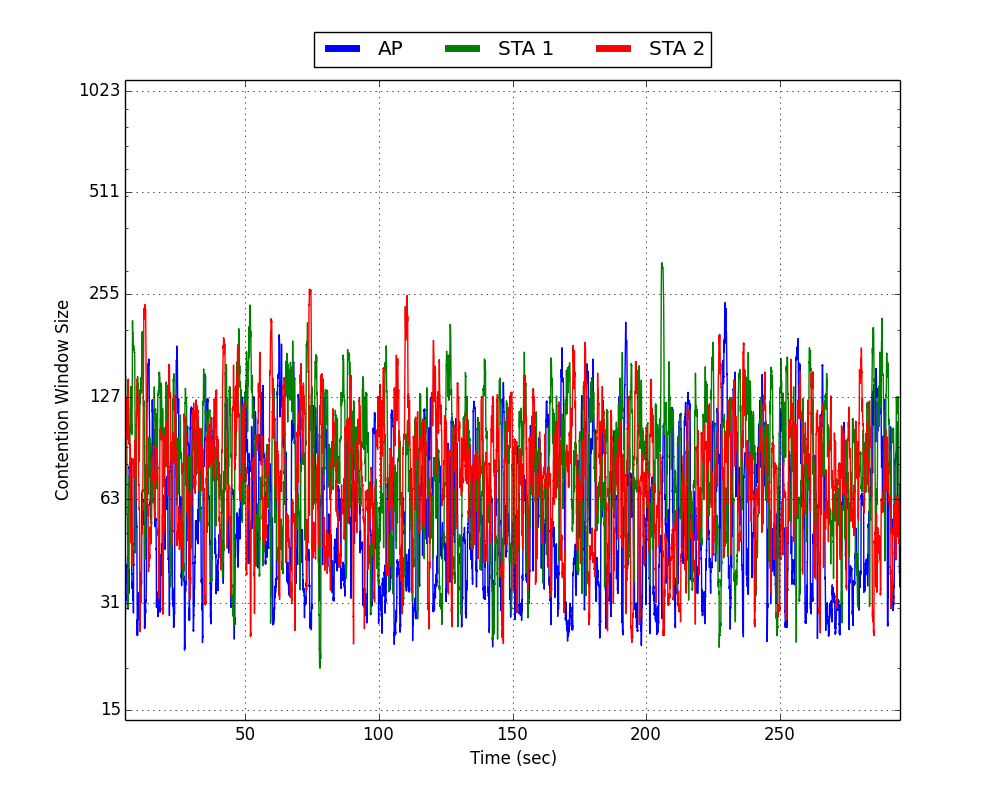
The contention window resets to its minimum following a successful transmission. When a collision occurs we expect a node's contention window to increase briefly, then reset when the transmission failure is resolved by a future re-transmission. But if collisions are very common (i.e. sequential transmission failures are frequent), we would expect to see higher contention window values that persist longer.
| Contention Windows at Each Node vs. Time | |
|---|---|
 | 
|
| Physical Carrier Sensing Enabled | Physical Carrier Sensing Disabled |
These plots show the actual contention window value of every node at the time of every PHY transmission. The contention window is only updated following PHY transmissions, so these plots capture the complete history of contention window values at every node. Note, the same rolling average technique used in the above throughput graphs is being employed here. This is why contention windows appear to take on values in between the powers of 2 values that the 802.11 standard specifies. The impact of physical carrier sensing on contention windows is dramatic. Disabling physical carrier sensing increases the probability of collisions. As explained above, more collisions lead to more transmission failures, leading to higher expected contention window values, resulting in longer backoff periods and lower throughput. This is exactly what the results show.
Characterizing Collisions
The 802.11 DCF attempts to avoid collisions by requiring every node wait (i.e. backoff) a random period and sense the medium before transmitting. The random wait is designed to stagger transmission attempts by nodes that are not otherwise coordinated. Collisions could be made less likely by using longer random backoff periods. But long backoff periods reduce overall medium utilization, negatively impacting performance. Shorter backoff periods increase medium utilization, but also increase the probability that nodes select the same random value and collide. The 802.11 DCF balances this tradeoff with its contention window definition, discussed above.
The DCF backoff procedure divides each waiting period into discrete slots. Nodes wait an integral number of slots before transmitting. The slot duration is 9 µsec.
When physical carrier sensing works correctly, we expect that collisions will occur when two nodes select the same backoff slot count and initiate their transmissions in the same slot. When physical carrier sensing is disabled, nodes will still collide when they choose the same slot count. But other nodes, with larger backoff slot values, will fail to sense the collision and will initiate their own transmission in a future slot that may overlap the ongoing colliding transmissions.
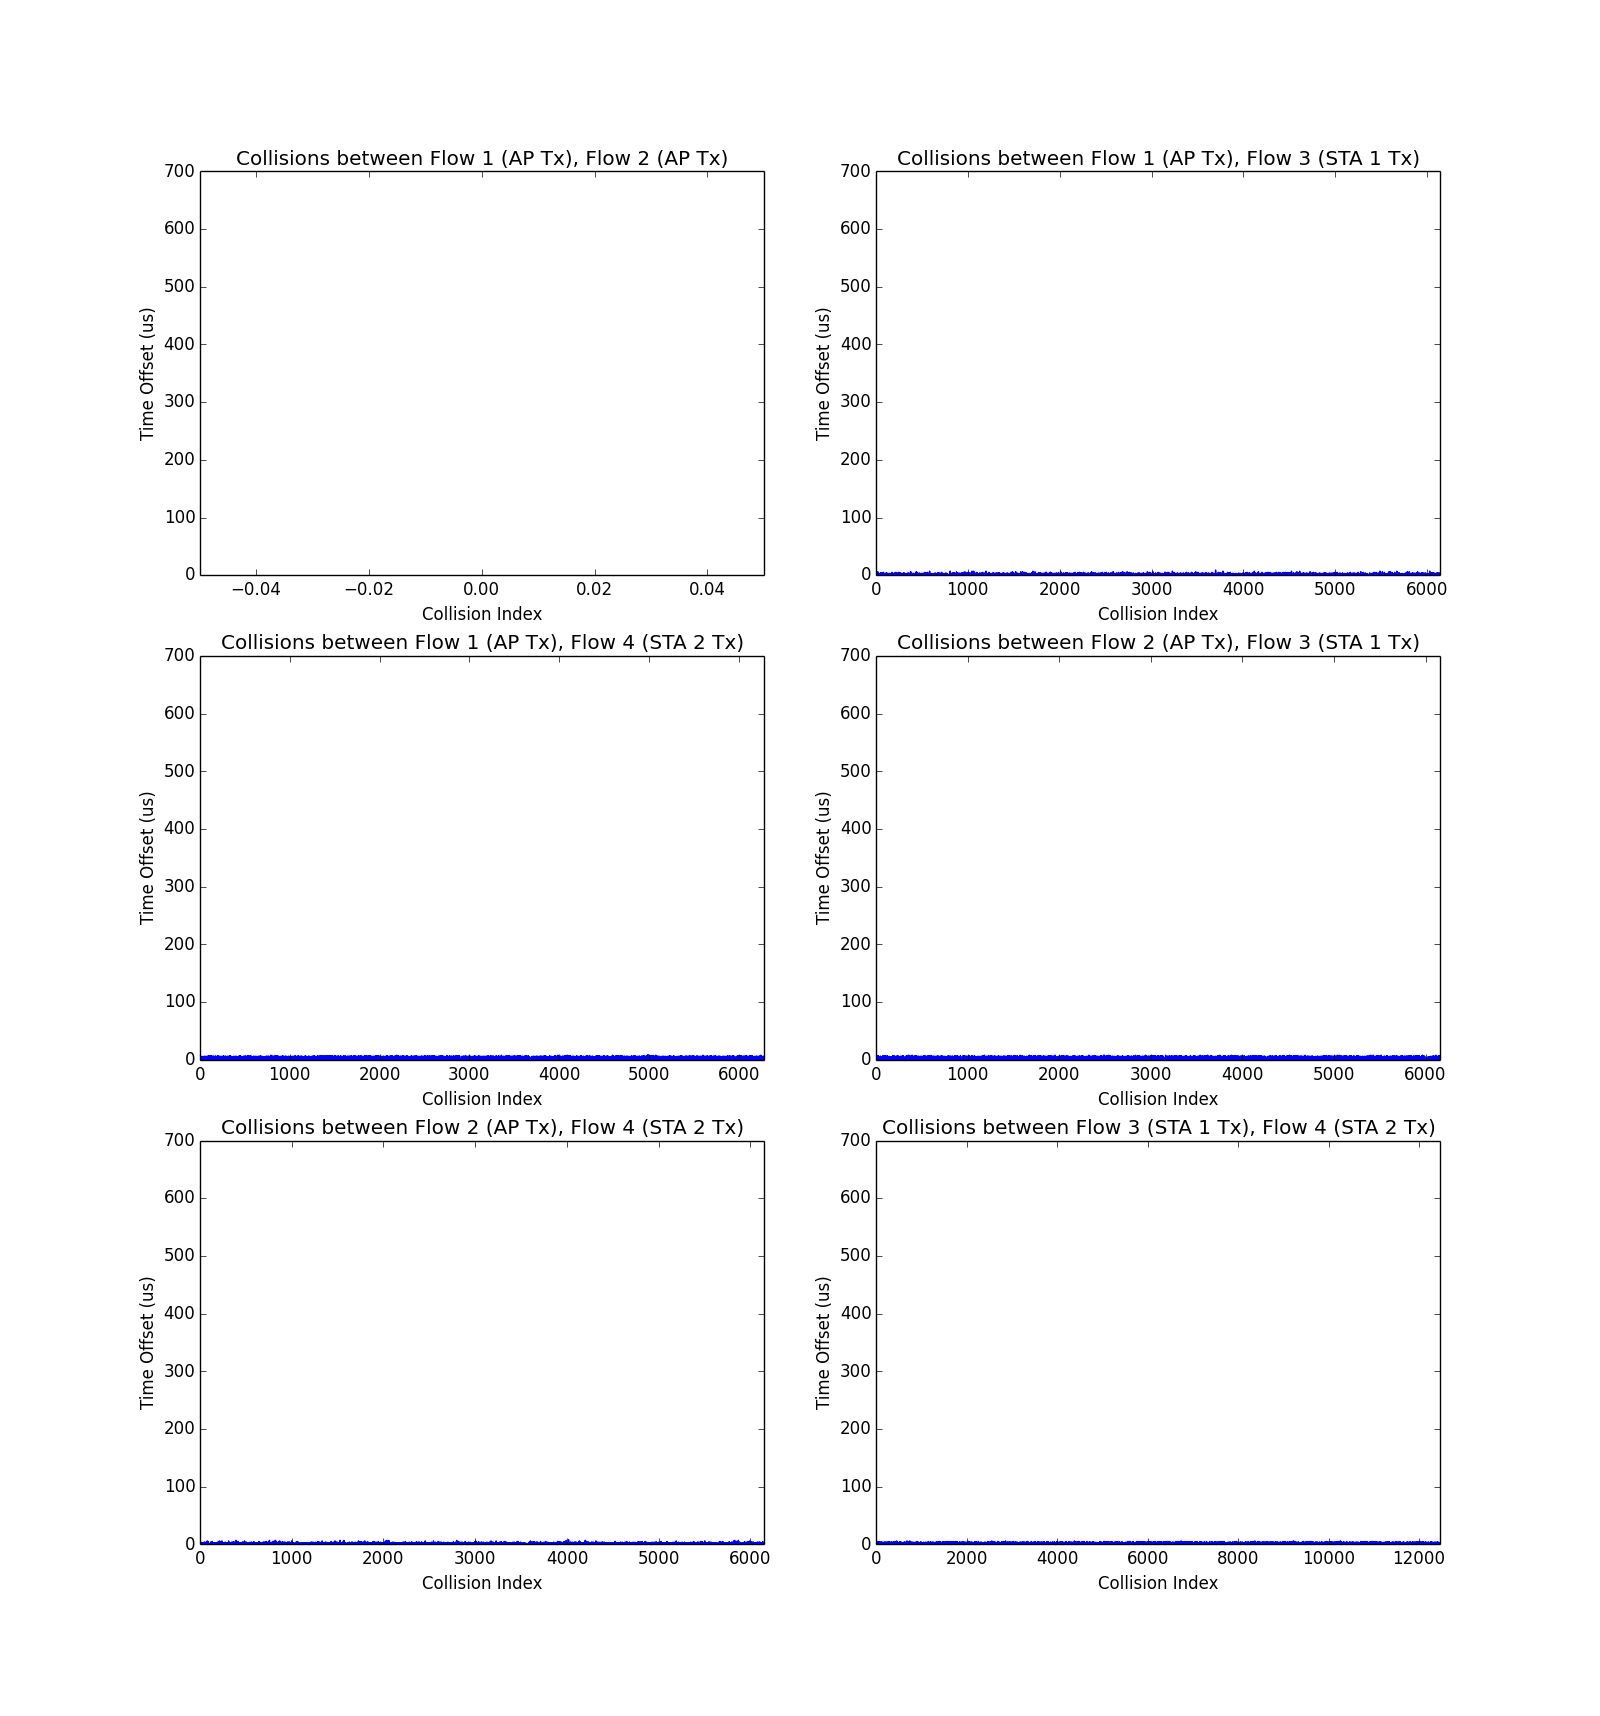
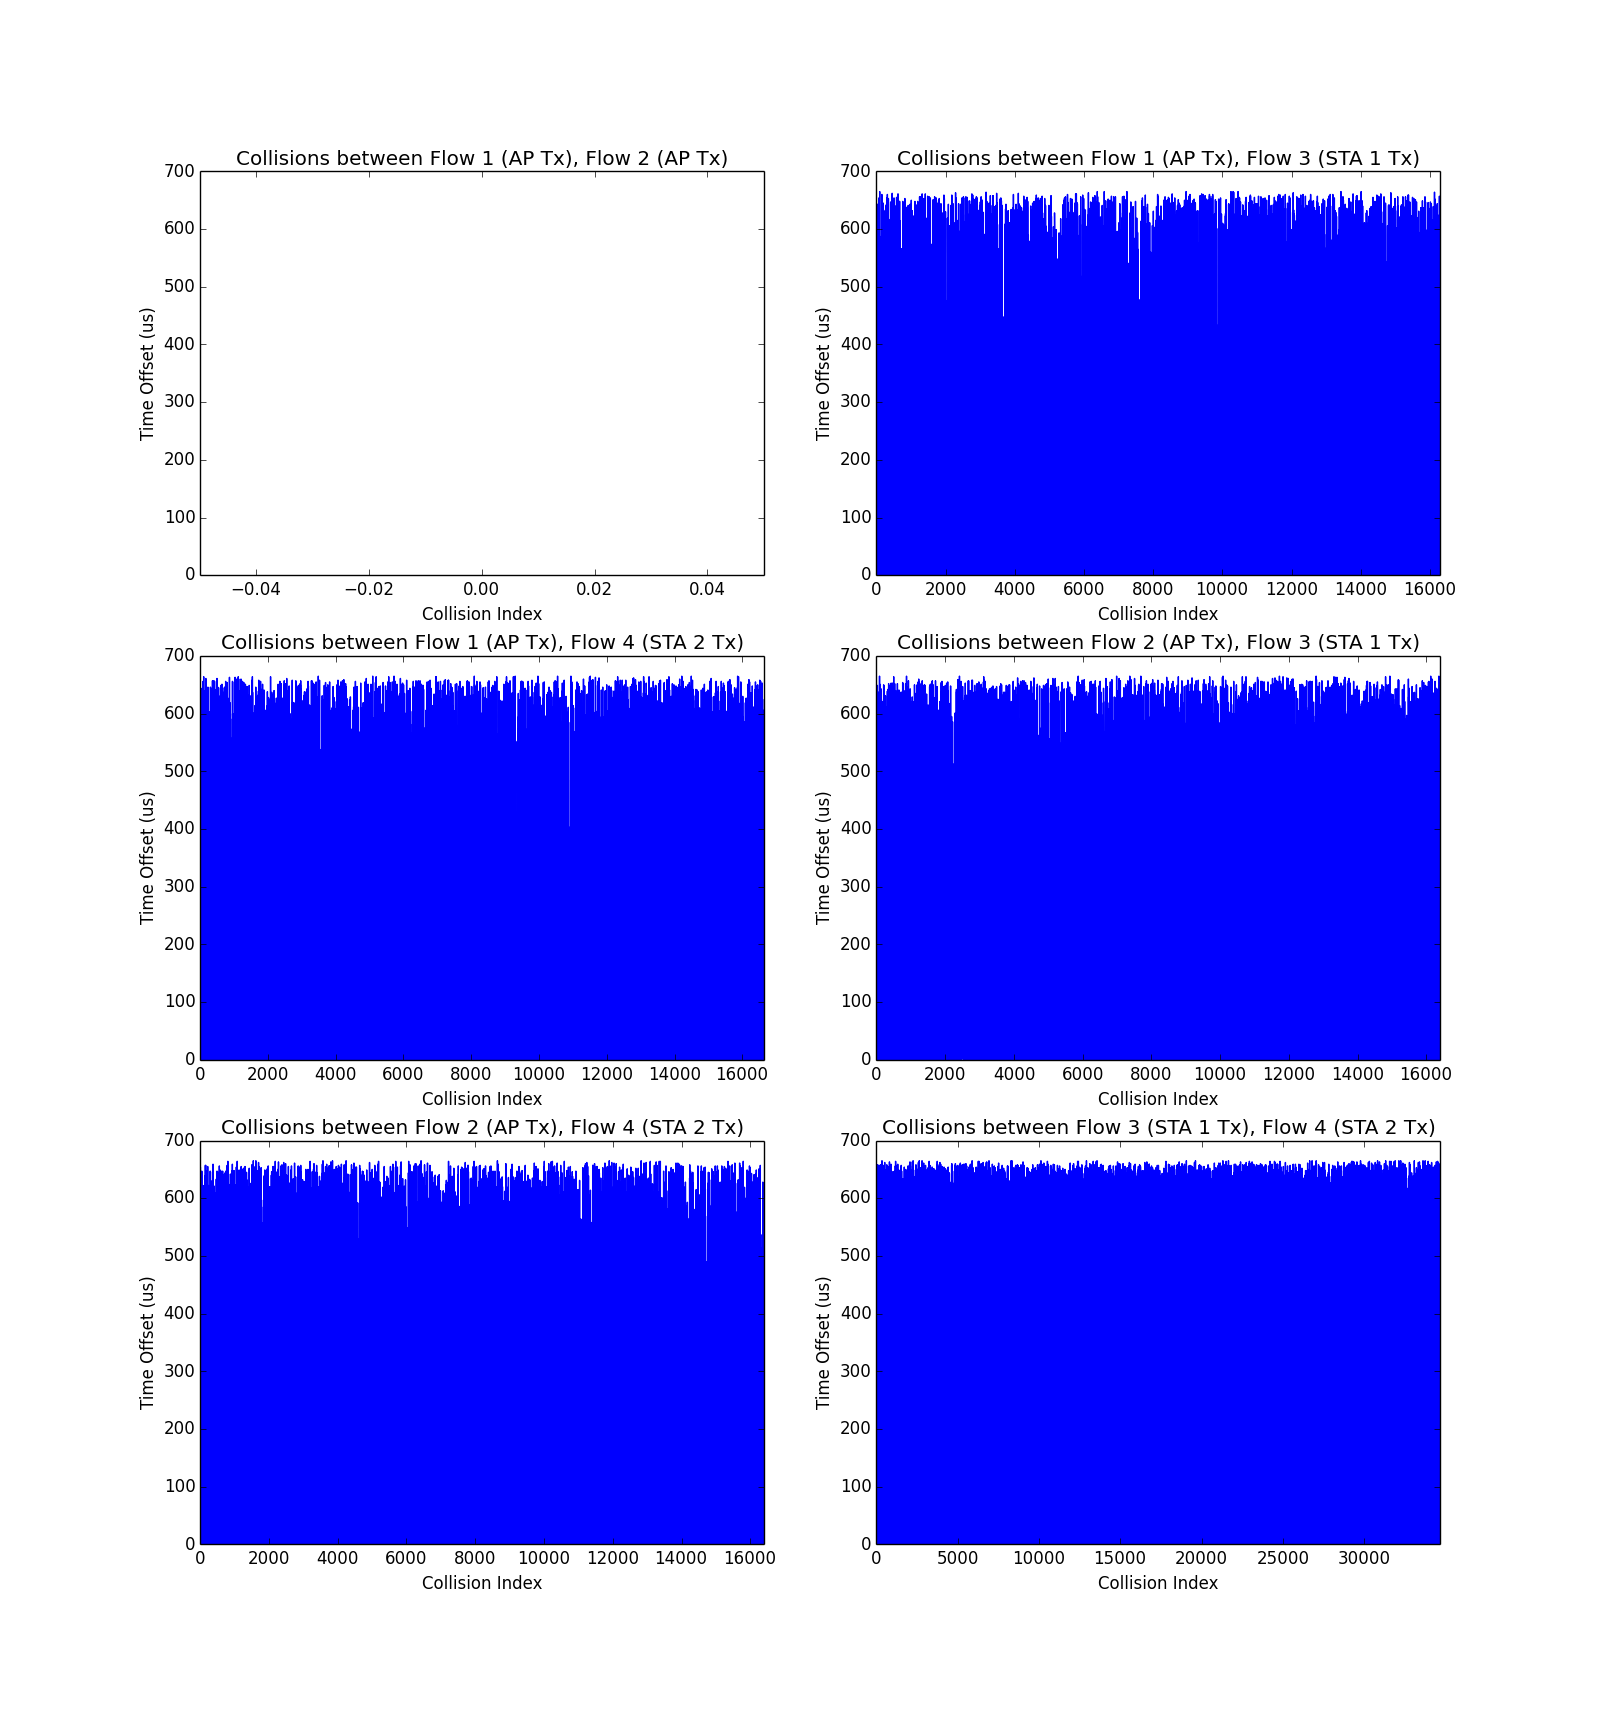
We can test these expectations by analyzing the timestamps of PHY Tx events in the node logs by extracting the Tx timestamps and Tx durations overlapping Tx events. When overlapping Tx events are located, the timestamps of the Tx events are compared to compute the difference in Tx start times. We expect this difference to be small (specifically, within a single 9 µs slot) when carrier sensing allows nodes to defer to ongoing collisions.
The plots below show the results of this analysis for all 4 traffic flows with physical carrier sensing enabled (left) and disabled (right).
| Collision Tx Start Time Offsets | |
|---|---|
 | 
|
| Physical Carrier Sensing Enabled | Physical Carrier Sensing Disabled |
These plots clearly demonstrate that physical carrier sensing leads to very small differences in Tx start times of colliding packets, consistent with our expectation of collisions occurring only when nodes select the same random backoff period. However, when carrier sensing is disabled, there are both more collisions and the collisions occur with a much larger range of Tx time offsets. This behavior increases the cost of a collision, reducing effective medium utilization and overall throughput.
There are several other behaviors to notice in the above figures. The x-axis in each figure is an index to the number of collisions. The maximum extent of the x-axis is the total number of collisions between the two nodes specified in the title of the figure. The reason the top-left subplot within each figure is empty is because Flow 1 and Flow 2 cannot collide -- both flow originate from the same node. The AP is not going to interrupt its own ongoing transmission. Also notice that the size of the x-axis for the CS-enabled case is generally smaller than the CS-disabled case. This is consistent with our earlier observation that disabling physical carrier sensing increases the probability of collisions.
Resources
Python Scripts
Download: multi-flow_python_scripts_v1_00.zip
- Requirements:
- 3 WARP v3 Kits configured as 1 AP and 2 STA
- Mango 802.11 Reference Design v1.0
Zip Contents:
- multi-flow_experiment.py - This script will run the experiment and write the log files from each board to the directory in which this script is executed.
- multi-flow_plotter.py - This script will open the generated log files and produce the plots used in the application note.
- log_analysis_util.py - Utility script that is used by multi-flow_plotter.py. This should not be run directly. Instead, it should be in the same directory as multi-flow_plotter.py
Experiment Data
In addition to providing the python scripts to gather and process the data in this application note, we also provide the actual data log files we gathered, processed, and presented.
Download: multi-flow_log_data_v1_00.zip (371MB)
Attachments (1)
- multi-flow_python_scripts_v1_00.zip (12.9 KB) - added by chunter 10 years ago.
Download all attachments as: .zip
